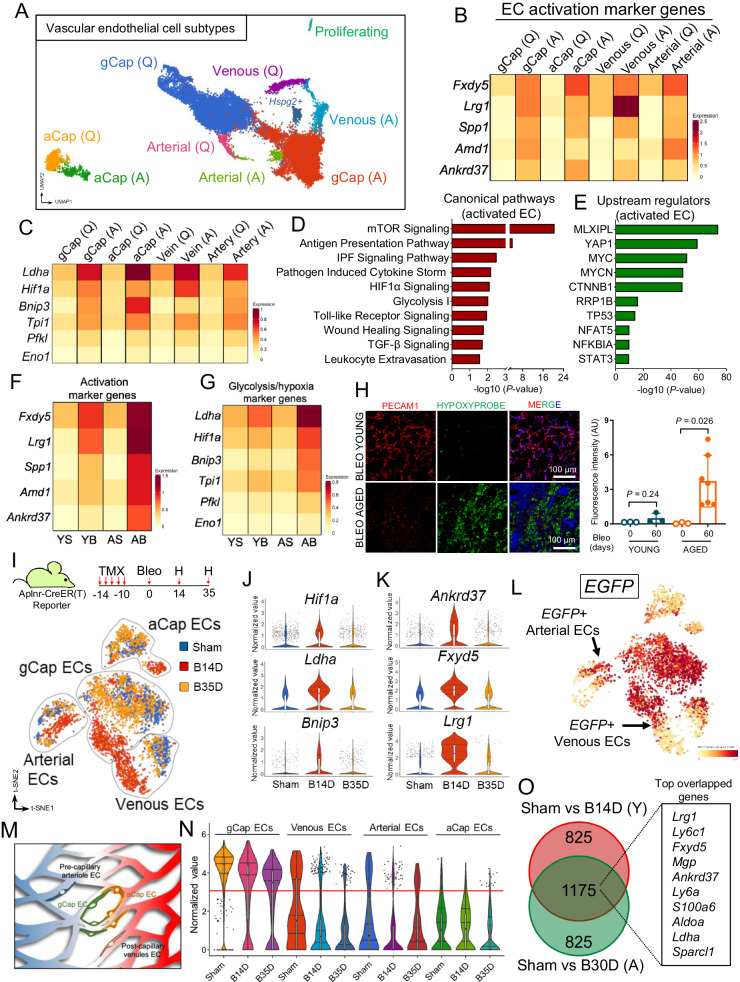
Fig. 1. Activation of mouse lung ECs following bleomycin challenge.
A UMAP embedded visualization of different EC subpopulations (n = 24,168 cells). B Heatmap showing differentially expressed activation marker genes in each EC subpopulation. C Heatmap showing differentially expressed hypoxia/glycolysis marker genes in each EC subpopulation. D, E Ingenuity pathway analysis shows canonical pathways and upstream regulators enriched in all activated ECs. P values were generated using Right-tailed Fisher’s Exact Test (log2 FC ≤ −0.5 or ≥0.5, P value ≤ 0.05). F Heatmap showing differentially expressed activation marker genes in each experimental group. Young Sham (YS, n = 5699 cells); Young Bleo (YB, n = 2208 cells); Aged Sham (AS, n = 6810 cells); Aged Bleo (AB, n = 9451 cells). G Heatmap showing differentially expressed hypoxia/glycolysis marker genes in each experimental group. H Hypoxia detection by hypoxyprobe in young and aged mouse lungs at 60 days post bleomycin administration. Immunofluorescence staining using antibodies against Pimonidazole adducts and PECAM-1 shows reduced number of alveolar ECs in fibrotic aged lungs exhibiting elevated hypoxia compared to young one in which hypoxia levels were undetectable. Values are summarized as mean ± SEM and analyzed using a two-tailed Student’s t-test. Young Bleo day 0 (n = 3), Young Bleo day 60 (n = 3), Aged Bleo day 0 (n = 3), Aged Bleo day 60 (n = 7). I Schematic showing the experimental strategy and t-SNE displaying different EC subpopulations in sham (Blue, n = 3), injured lungs after 14 days (B14D, Red, n = 2), and injured lungs at 35 days (B35D, Orange, n = 2;) post bleomycin-induced lung injury. J, K Violin plots showing increased expression of activation and hypoxia/glycolysis marker genes in injured aged lungs at 14 days followed by a return to baseline during the early resolution phase (day 35 post bleomycin challenge), sham (n = 1994 cells), B14D (n = 2164 cells), and B35D (n = 1807 cells). L t-SNE plots showing the expression of EGFP across different EC clusters (n = 5965 cells). M Schematic showing arterial and vein EC subtypes expressing capillary markers. N Violin plot showing the expression of EGFP across different EC subpopulations (n = 5965 cells). O Venn diagram shows nearly 60% transcriptional overlapping between EC states at day 14 post bleomycin (young lungs (Y)) and day 30 post bleomycin (aged lungs (A)). The top two thousand differentially expressed genes (P < 0.05, determined by BioTuring Browser 3) were included in this analysis. Each box plot displays the median value as the center line, the upper and lower box boundaries at the first and third quartiles (25th and 75th percentiles), and the whiskers depict the minimum and maximum values. Source data are provided as a Source Data file.

