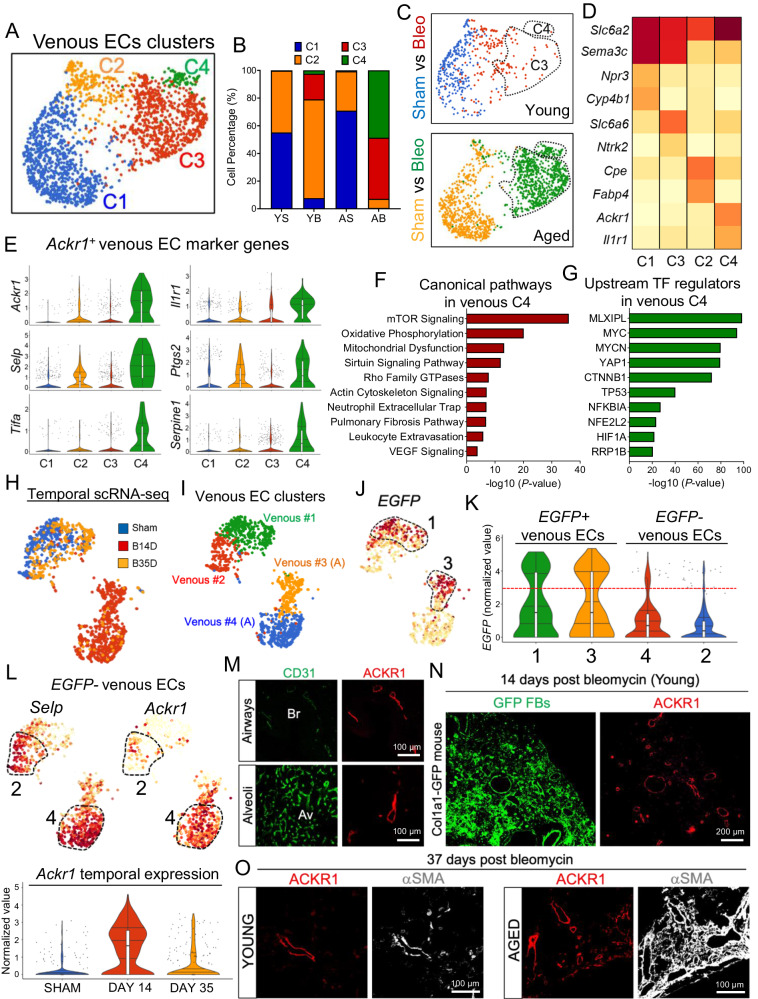
Fig. 2. Venous EC remodeling in young and aged mouse lungs following bleomycin challenge.
A UMAP plots showing venous EC clusters (n = 1961 cells). C; cluster. B, C Composition and UMAP plots displaying venous EC clusters in young (YS, Blue, n = 302 cells) and aged (AS, Orange, n = 658 cells) uninjured lungs, and young (YB, Red, n = 199 cells) and aged (AB, Green, n = 802 cells) injured lungs. Venous ECs in Clusters 3 and 4 exclusively emerged in bleomycin-injured lungs and their number increased in fibrotic aged lungs compared to young ones. D Heatmap showing average expression of venous EC marker genes across different venous EC clusters (E) Violin plots showing the expression of distinctive marker genes in activated venous ECs (clusters 4). C1 (n = 873 cells), C2 (n = 231 cells), C3 (n = 778 cells), C4 (n = 79 cells). F, G Ingenuity pathway analysis shows canonical pathways and upstream regulators enriched in activated venous ECs (clusters 4). P values were generated using Right-tailed Fisher’s Exact Test (log2 FC ≤ −0.5 or ≥ 0.5, P value ≤ 0.05). H, I UMAP embedded visualizations of different venous EC clusters during different time point of bleomycin challenge, sham (n = 383 cells), bleomycin 14 days (B14D, n = 703 cells), bleomycin 35 days (B35D, n = 253 cells), Venous #1 (n = 404 cells), Venous #2 (n = 229 cells), Venous #3 (n = 271 cells), Venous #4 (n = 435 cells). A; Activated. J, K UMAP and violin plots showing the expression of EGFP across different venous EC clusters (n = 1339 cells). L UMAP and violin plots showing the expression of Selp and Ackr1 genes across different venous EC clusters (n = 1339 cells). M Immunofluorescence staining showing ACKR1 (venous EC marker) and CD31 (Pan-endothelial marker) expression in lung airways and alveoli at baseline. Br; Bronchiole, Av; Alveoli. N Immunofluorescence staining showing ACKR1 expression in Col1a1-GFP mouse lung at 14 days after bleomycin injury. O Immunofluorescence staining using antibodies against ACKR1 and α-SMA in young and aged lungs following bleomycin injury. ACKR1 positive venous EC accumulates in lung areas exhibiting extensive remodeling. Each box plot displays the median value as the center line, the upper and lower box boundaries at the first and third quartiles (25th and 75th percentiles), and the whiskers depict the minimum and maximum values. Source data are provided as a Source Data file.

