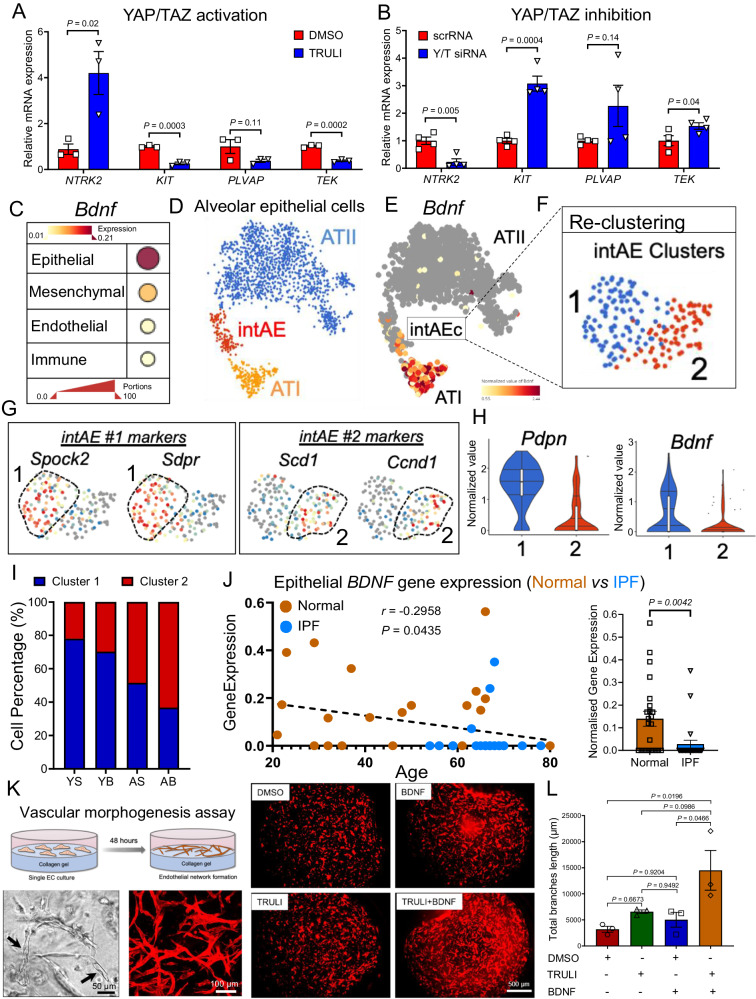
Fig. 8. Activation of YAP/TrKB axis enhances lung capillary morphogenesis.
A, B qPCR analyses of human lung microvascular ECs (HLMVECs) treated with the LATS1/2 inhibitor TRULI and siRNAs targeting YAP and TAZ for 48 or 72 h, respectively. YAP activation in these cells partially recapitulates the gene expression signature observed in activated gCap ECs. Values are summarized as mean ± SEM and analyzed using a two-tailed Student’s t-test. Yap activation (n = 3 independent experiments), YAP/TAZ inhibition (n = 4 independent experiments). C Dot plot showing the expression of Bdnf in different populations of lung cells. Dot size indicates the proportion of expressing cells, colored by standardized expression levels. D t-SNE plot showing different alveolar epithelial cell clusters. ATII (Blue, n = 1470 cells), intermediate AE (intAE, Red, n = 176 cells), and ATI (Orange, n = 229 cells). E t-SNE plot showing the expression of Bdnf in intAE and ATI. F, G UMAP visualization of intermediated alveolar epithelial cell clusters and marker gene signatures. H Violin plots showing the expression of ATI cell marker gene, Pdpn, and Bdnf in intAE clusters, 1 (103 cells), 2 (73 cells). Each box plot displays the median value as the center line, the upper and lower box boundaries at the first and third quartiles (25th and 75th percentiles), and the whiskers depict the minimum and maximum values. I Cell composition in each intAE cluster. Most intermediate alveolar epithelial cells exhibiting ATII marker genes (less differentiated) were from bleomycin-treaded aged lungs. Young Sham (YS); Young Bleo (YB); Aged Sham (AS); Aged Bleo (AB). J Expression of BDNF ATI cells derived from human normal (n = 23) and IPF (n = 24) lung. Values are summarized as means ± SEM and analyzed using a two-tailed Student’s t-test (K) Schematic showing the in vitro 3D endothelial morphogenesis assay. Staining of HLMVECs with phalloidin shows that BDNF and TRULI treatment synergistically promote tube formation. L Quantitative analysis of vascular morphogenesis was indicated as the total branches length. Image analysis in the whole photographed area were performed by angiogenesis analyzer (ImageJ software). Values are summarized as means ± SEM, P values were generated using one-way ANOVA with Tukey’s post hoc test for comparison. n = 3 independent experiments. Source data are provided as a Source Data file.

