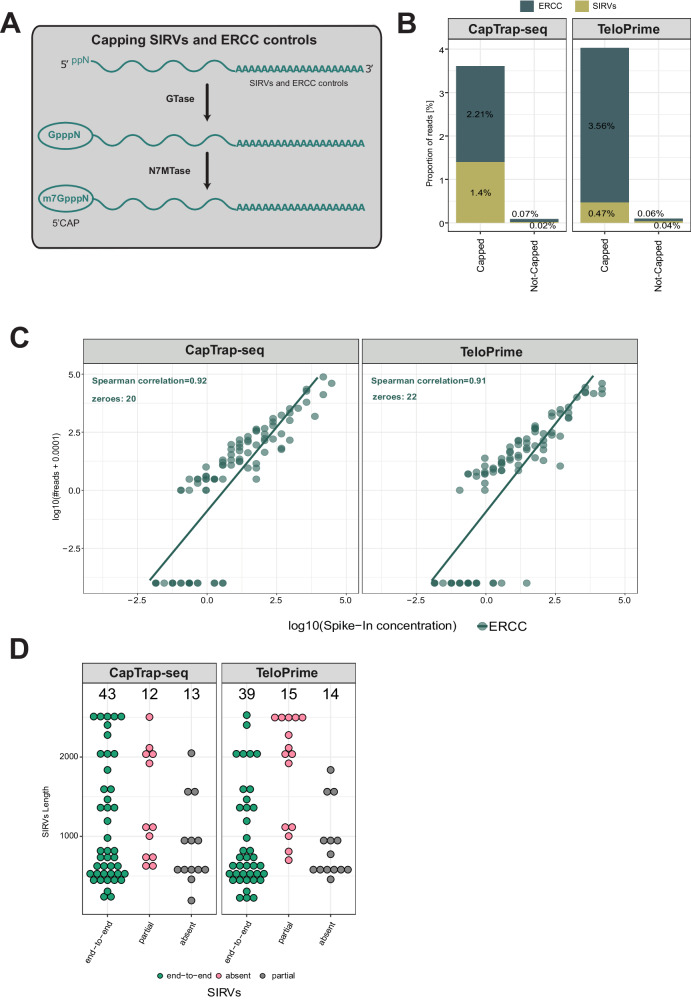
Fig. 4. Capping of SIRVs and ERCC controls in the human brain sample using ONT.
A Two-step enzymatic strategy for adding a cap structure at the 5’ ends of uncapped RNA spike-in controls; B Detection rate of SIRVs (yellow-green) and ERCC (navy) synthetic controls; C Correlation between input RNA concentration and raw read counts for ERCC spike-ins in the brain sample. Each point represents a synthetic ERCC control. The green line indicates a linear fit to the corresponding dataset; D Detection of SIRVs as a function of length. Three main detection levels have been distinguished: end-to-end (green), partial (red), and not detected/absent (gray). The black numbers displayed at the top indicate the total number of SIRVs for each detection level.

