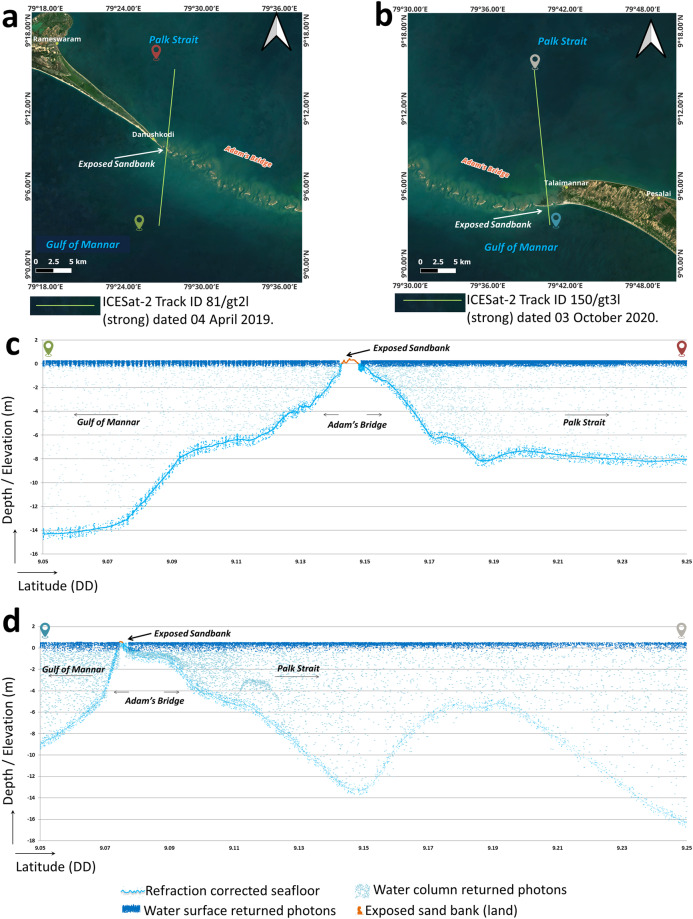
Fig. 5.
Illustration of seafloor variation at Adam’s Bridge using the profiles from ICESat-2 photons. (a) ICESat-2 beam acquired over the Adam’s Bridge (at the tail-end of Dhanushkodi) and overlaid on the satellite data. (b) Subset of the ICESat-2 beam acquired over the Adam’s Bridge (at the head of Talai Mannar) and overlaid on the satellite data. (c) 2-dimensional profile showing the refraction-corrected seafloor for the beam corresponding to (a). (d) 2-dimensional profile showing the seafloor variation for the beam corresponding to (b). Both the profiles shown in (c) and (d) signify the presence of Adam’s Bridge’s structure, which gradually rises from a depth of nearly 8 m to the surface of the water level.

