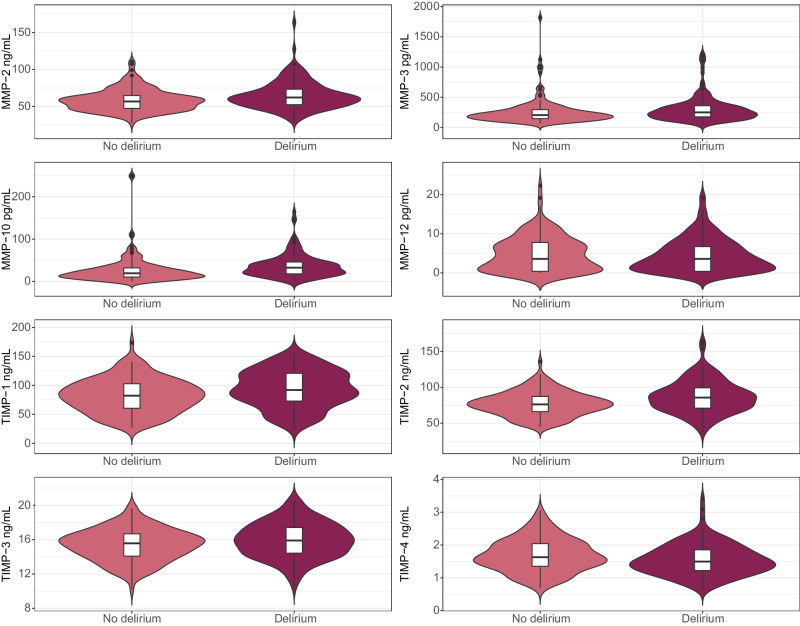
Fig. 1.
Distributions of cerebrospinal fluid MMP and TIMP levels across the hip fracture patients with no delirium (n = 139) and with delirium (n = 140). The violin plots show the entire distribution of each marker, whilst the inserted box plot shows the median (middle line), 1st quartile (lower box limit) and 3rd quartile (upper box limit). Black lines show the minimum (minimum data value – 1.5*interquartile range) and maximum (maximum data value + 1.5* interquartile range). Black circles show outliers. MMP matrix metalloproteinase, TIMP tissue inhibitor of matrix metalloproteinase.

