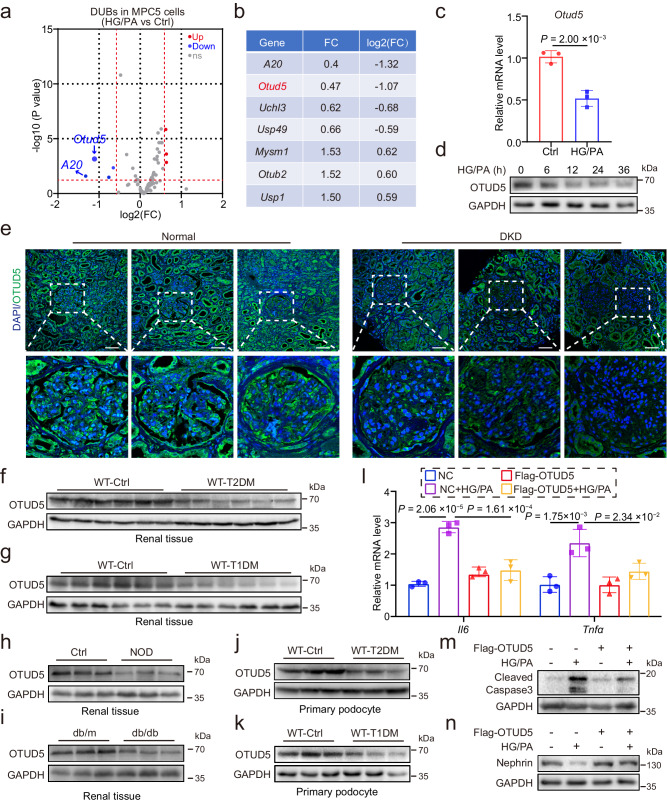
Fig. 1. Identification of OTUD5 as a regulator of podocyte inflammation and injury.
a A volcano plot analysis illustrating the differential expression of DUBs induced by HG/PA in podocytes. (n = 3 samples for each Ctrl group and HG/PA group; P values were determined by Wald test from DESeq2 software with Benjamini-Hochberg’s correction). b A table shows DUBs with significant differences in MPC5 cells treated with HG/PA. c The mRNA level of Otud5 in HG/PA-induced MPC5 cell lines. (n = 3 independent experiments; P values were determined by two-tailed unpaired t-test and data are presented as mean ± SD). d Representative western blot of OTUD5 expression in MPC5 cell lines after stimulation with HG/PA for different durations. (n = 3 independent experiments). e Representative immunofluorescence (IF) images of OTUD5 expression in human renal tissue from normal subjects (n = 3 samples) and patients with DKD (n = 3 samples). Scale bar, 50 μm. Representative western blot of OTUD5 expression in renal cortex of T2DM (f) mice and T1DM mice (g). (n = 6 samples). Representative western blot of OTUD5 expression in renal cortex of NOD (h) mice and db/db mice (i). (n = 6 samples). j, k Representative western blot of OTUD5 expression in primary podocytes of T2DM (j) and T1DM (k) mice. (n = 6 samples). l MPC5 cells transfected with Flag-OTUD5 were stimulated with HG/PA for 8 h. Real-time qPCR showed the mRNA levels of Il6 and Tnfα. (n = 3 independent experiments; P values were determined by one-way ANOVA with Bonferroni’s correction and data are presented as mean ± SD). Representative western blot of Cleaved Caspase3 (m) and Nephrin (n) expression in OTUD5-overexpression podocytes stimulated by HG/PA for 24 h. (n = 3 independent experiments).

