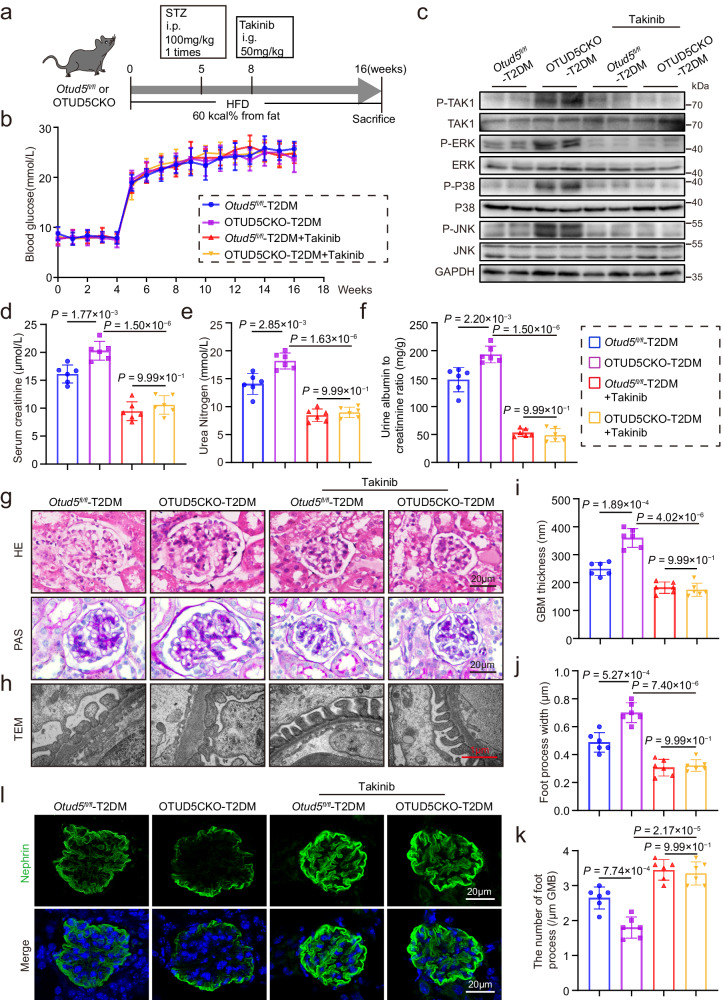
Fig. 6. Inhibition of TAK1 eliminates the aggravated podocyte injury and DKD in OTUD5CKO-T2DM mice.
a A schematic diagram illustrating the procedure of T2DM-induced OTUD5CKO and Otud5fl/fl mice, with or without Takinib administration. b Weekly measurements of blood glucose levels of the mice in the indicated groups. Data are presented as mean ± SD. c Representative western blot images showing phosphorylated and total protein levels of TAK1, ERK, P38, and JNK in the kidneys of indicated groups. (n = 6 samples). Serum creatinine (d), urea nitrogen (e), and urine albumin to creatinine ratio (f) levels of the mice in the indicated groups. g Representative H&E and PAS staining images of kidney sections. Scale bar: 20 μm. (n = 6 samples). h–k Representative TEM images of kidney sections and corresponding quantitative analysis. Scale bar: 1 μm. l Representative IF images of Nephrin expression in the glomeruli of the indicated groups. Scale bar, 20 μm. n = 6 for each group. For d–f, i, j, and k, P values were determined by one-way ANOVA with Bonferroni’s correction, and data are presented as mean ± SD.

