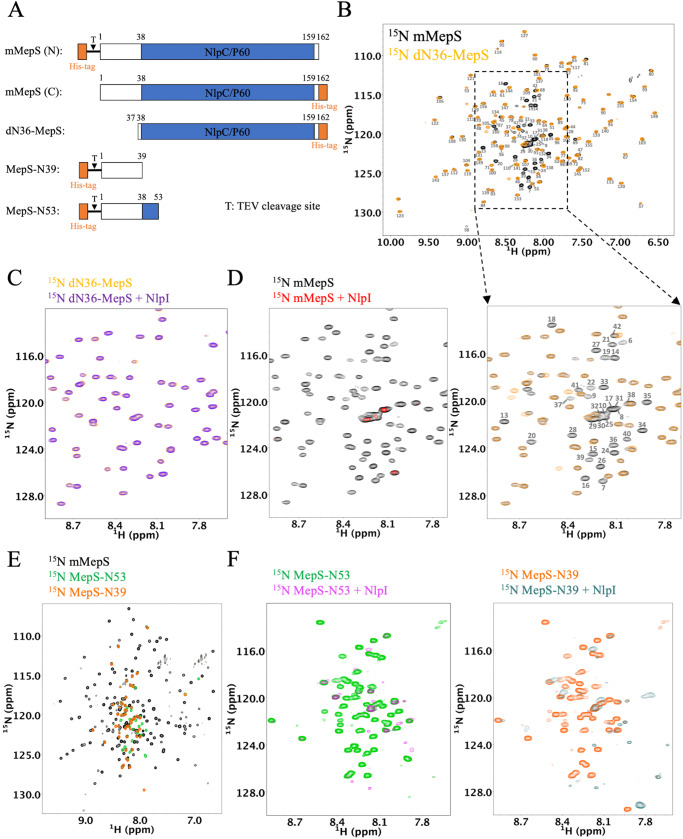
Fig. 1. NMR characterization of interactions of NlpI with various mMepS protein constructs.
A Schematic representation of MepS constructs utilized for investigating the role of the N-terminal region. The mature full-length construct (mMepS) consists of the N-terminal disorder region (1–37, shown in white) and the C-terminal NlpC/P60 domain (shown in blue). The dN36-MepS mutant lacks the 36 amino acids at the N-terminal while MepS-N39 and MepS-N53 contain only the N-terminal 39 and 53 residues, respectively. T denotes the TEV cleavage site. The lipidation site of MepS at residue C1 in its mature form is replaced with Methionine in all MepS constructs. B Comparison of the 1H-15N TROSY-HSQC spectra of mMepS (in black) and dN36-MepS (in yellow) obtained at 25 °C. The cross-peaks are annotated with the residue numbers of mMepS. The overlay of the expanded region of the 2D spectrum highlights the natively disordered N-terminal of mMepS. C 1H-15N TROSY-HSQC spectra of dN36-MepS (50 µM) were acquired in both the absence (yellow) and presence (purple) of the unlabeled NlpI dimer (25 µM). Analysis using two-dimensional 1H-15N NMR spectroscopy reveals a reduction in peak intensity. D 1H-15N TROSY-HSQC spectra of mMepS (50 µM) were acquired in both the absence (black) and presence (red) of unlabeled NlpI dimer (25 µM). E Overlaying the 1H-15N HSQC spectra of mMepS (in black), MepS-N53 (in green), and MepS-N39 (in orange) acquired at 25 °C. F The spectral data display the cross-peaks for both MepS-N53 and MepS-N39 in the presence of NlpI, represented by magenta and cadet blue colors. The MepS-N39 and MepS-N53 truncated mutant samples were prepared without TEV protease treatment, and the less affected peaks are mainly from the His-tag and TEV sites.

