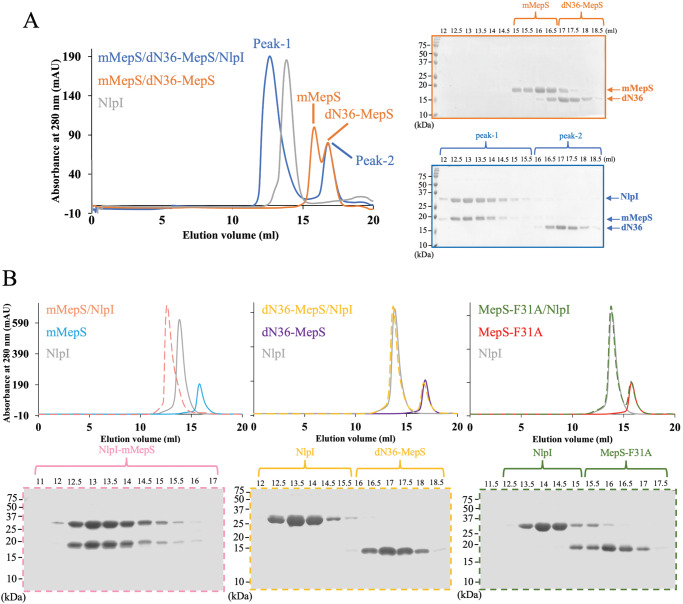
Fig. 2. Exploring the involvement of the disordered N-terminal region of mMepS in the formation of the NlpI-mMepS complex via size exclusion chromatography.
A The gel filtration profile of a sample containing equimolar concentrations of mMepS, dN36-MepS, and NlpI is depicted in blue. Subsequent analysis using Coomassie-blue stained SDS-PAGE gel on the peak fractions. The elution profiles of NlpI dimer alone and the sample containing two proteins (mMepS and dN36-MepS) are represented in grey and orange, respectively. B Purified NlpI was mixed with mMepS (pink), dN36-MepS (yellow), or MepS-F31A (green) and then analyzed using gel filtration chromatography to assess the formation of complexes. Dashed lines were employed to delineate distinct protein mixtures, enhancing the clarity and visibility of each line. All experiments were conducted using the Superdex200 10/300 GL column (GE Healthcare), and elution peaks were monitored through UV absorbance at 280 nm. The resulting SEC elution profiles were further confirmed by Coomassie-stained SDS-PAGE gels, with each gel corresponding to specific peak fractions and distinguished by different colors. The data represent a single experiment out of three independent (n = 3) measurements. Source data are provided as a Source Data file.

