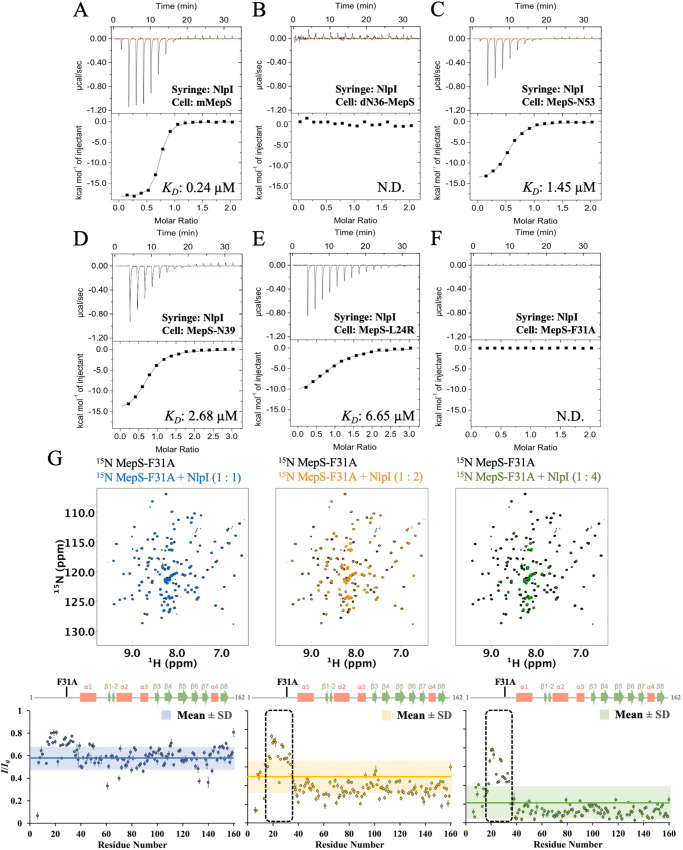
Fig. 4. Structure-derived mutants of mMepS at the binding interface perturb interaction with NlpI in vitro.
A–F The ITC fitting curves illustrate the interactions between wild-type mMepS and MepS mutants with NlpI. The presented raw data, post-baseline correction (top), along with the corresponding binding isotherms (bottom), depict the integrated heat peaks plotted against the molar ratio of ligands. The data represent a single experiment out of three independent (n = 3) measurements and the results are presented as the mean values ± standard deviations. The KD values are labeled and detailed in Supplementary Table 2. The designation “N.D.” indicates that it is not determined under our experimental conditions. G green, respectively). Titrations of MepS-F31A with NlpI are illustrated at 1:1 (blue), 1:2 (orange), and 1:4 (green) ratios. The ratio of NMR signal intensities, denoted as I/I0, refers to the signal intensity of NlpI-bound MepS-F31A (I) relative to that of free MepS-F31A (I0). The average intensity ratio for each titration is displayed using its corresponding color code, while the ranges of the mean values ± one standard deviation are depicted with shading. The dashed-line box identifies residues exhibiting intensity ratios above the average plus one standard deviation, attributed to the point mutation F31A. Additionally, the secondary structure of mMepS is indicated above for reference. Data of one representative experiment performed on n = 2 biologically independent samples. The lack of intensity ratios in some residues could result from proline residues, unassigned residues, or residues with overlapping signals, potentially affecting measurement accuracy. The error bar reflects the uncertainty derived from the peak’s signal-to-noise ratio. Source data are provided as a Source Data file.

