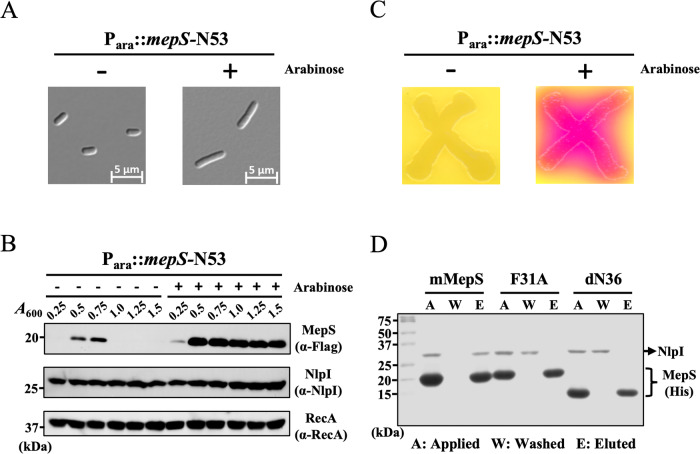
Fig. 6. The overexpression of the N-terminal region of MepS has physiological effects on the morphology and cell wall integrity of E. coli.
A Cell morphology was visualized using differential interference-contrast (DIC) microscopy to examine the impact of MepS-N53 overexpression. MG1655 WT cells carrying a plasmid with meps-N53 were cultured in LB medium at 37 °C with or without arabinose induction. The overexpression of MepS-N53 resulted in noticeable changes in the morphology of E. coli. Data from one representative experiment were obtained using n = 3 biologically independent samples, with scale bars indicating 5 µm. B Cellular levels of MepS were evaluated at different growth stages using immunoblot analysis of a chromosomal MepS-3XFlag derivative. Overexpression of MepS-N53 led to a significant increase in MepS levels during both the exponential and stationary phases, whereas MepS levels in non-inducing cells sharply decreased during the stationary phase. Additionally, using an NlpI-specific antibody, it was confirmed that NlpI protein levels were confirmed remained unchanged in the MepS-N53 overexpressing strain. RecA was used as a loading control in the analysis. Data from one representative experiment were obtained using n = 3 biologically independent samples. C The impact of N53-induced cell shape changes on the cell envelope was assessed using an envelope integrity assay with CPRG, a galactopyranosidase substrate indicating envelope defects. Cells of MG1655 wild-type strain, harboring a plasmid with meps-N53, were cultured on CPRG indicator agar to assess cell wall integrity. CPRG (yellow) is incapable of permeating intact Gram-negative envelopes. The transformation of CPRG to CPR (red) through intracellular β-galactosidase activity serves as an indicator of compromised envelope integrity. Data of one representative experiment were obtained using n = 3 biologically independent samples. D Pull down assay was performed to demonstrate the interaction between NlpI and mMepS, as well as MepS mutants. The assays were conducted with physiological concentrations of NlpI and MepS at 2 µM and 19 µM, respectively. The samples from Ni2+-NTA pull-down assays of mMepS-His, F31A-His, and dN36-His with NlpI were subjected to SDS-PAGE analysis, including the applied (A), washed (W), and eluted (E) samples. Data from one representative experiment were obtained using n = 3 biologically independent samples.

