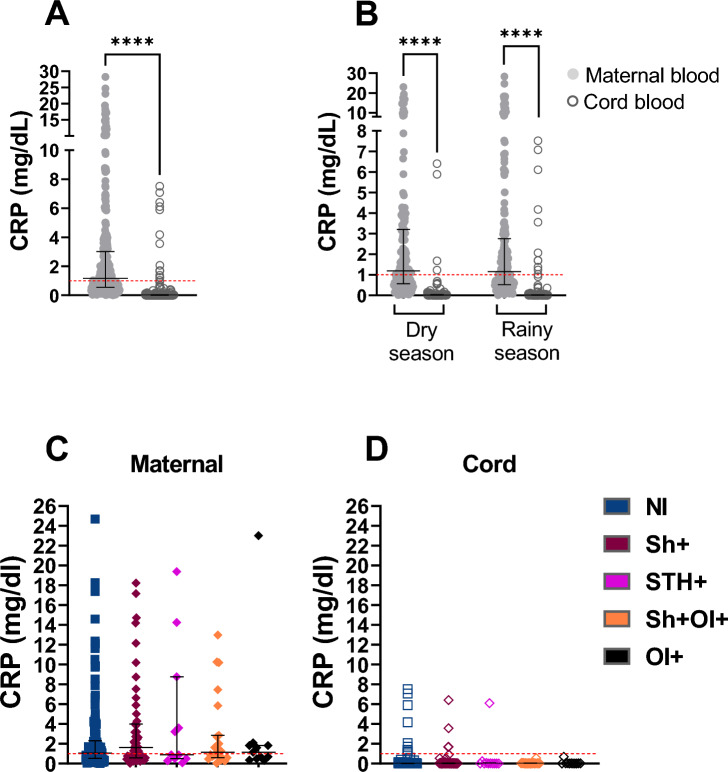
Figure 4.
Impact of maternal infection on maternal and newborn C-reactive protein CRP level. (A) overall CRP level in all the cohort n (maternal) = 328; n (cord) = 328; (B) overall CRP level in the cohort according to the dry and rainy season n (maternal) = 328; n (cord) = 328; n (maternal N/I) = 137; n (maternal Sh +) = 55; n (maternal STH +) = 11; n (maternal Sh + OI) = 23; (maternal OI +) = 11; n (cord NI) = 137; n (cord Sh +) = 55; n (cord STH +) = 11; n (cord Sh + OI) = 23; (cord OI +) = 11; (C) maternal CRP level within the 5 main groups; (D) cord CRP level within the 5 main groups; CRP concentration : < 1 mg/dL. Data are shown with median and interquartile range. P values are for Wilcoxon matched-pairs-Test and Mann–Whitney test. P value: * = < 0,05; ** = < 0,01; *** = < 0,001; **** = < 0,0001.

