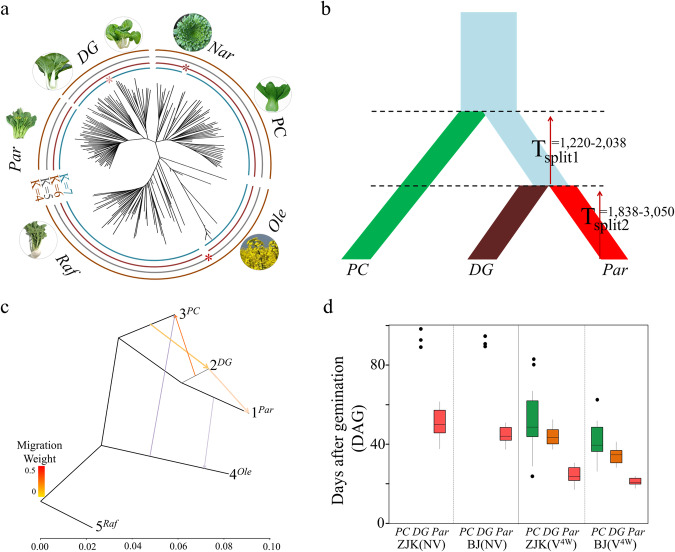
Fig. 1. A stepwise model for speciation of subsp. chinensis var. parachinensis (Par).
a Neighbor-joining (N-J) tree of the 210 lines. An unrooted phylogenetic tree of the 210 lines was constructed using the N-J method under the Kimura 2-parameter model implemented in MEGA-CC (v 7.0). Bootstrap support > 50% calculated from 1000 replicates is shown. b The best demographic model evaluated using ∂a∂i. At time Tsplit. The time of the split was estimated in the generation time, which was converted to years, assuming one generation per year. We used STRUCTURE K = 6 as the likelihood ratio, which can also satisfy the requirements of both STRUCTURE and empirical classification. c Inferred B. rapa tree showing the directions of gene flow in each group. Arrows indicate the direction of gene flow, while the line colors represent the migration weight based on the sample number. The horizontal branch length is proportional to the amount of genetic drift that has occurred on the branch. Scale bars represent 100-fold average standard error (SE) for the entries in the sample covariance matrix. d Population phenotypic differentiation for the bolting time of PC, DG, and Par in Zhangjiakou (ZJK) and Beijing (BJ), respectively. Flowering time of 50 PC, 41 DG and 44 Par accessions from our germplasm collection were investigated. The flowering time was evaluated with (denoted as V4W) or without (denoted as NV) 4 weeks vernalization in ZJK and BJ, respectively. Bolting time, days after germination (DAG), was defined as the number of days from sowing to the appearance of the visible bud. The box encompasses two middle quartiles, with a central line showing the median. Whiskers extend to the furthest data point within 1.5 times the interquartile range. Par represents B. rapa subsp. chinensis var. parachinensis, DG represents B. rapa subsp. chinensis var. Dark-green, PC represents B. rapa subsp. chinensis (pak choi).

