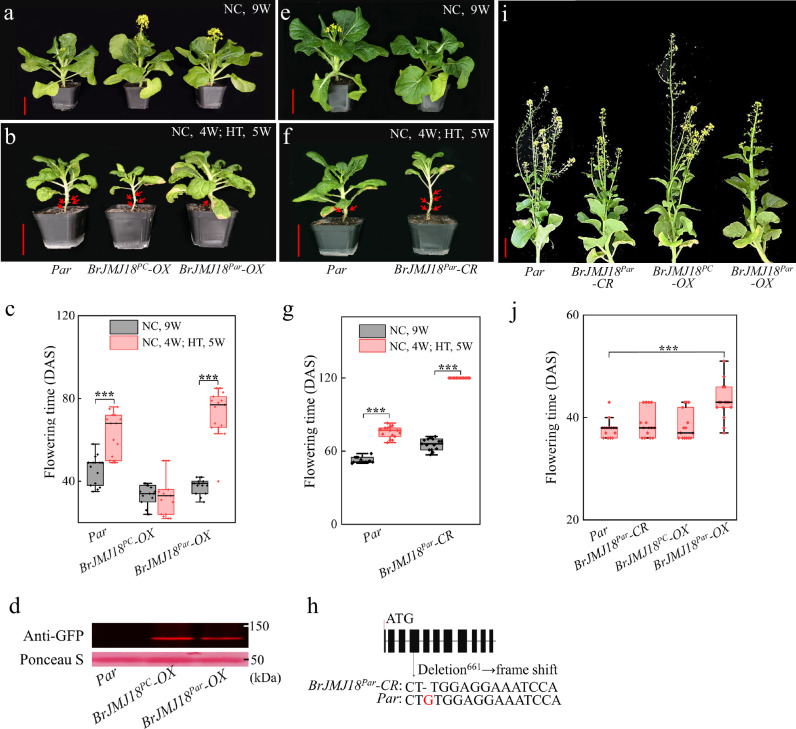
Fig. 3. Flowering characterizations of the BrJMJ18 transgenic Par plants under greenhouse and field conditions, respectively.
a–h Phenotypes of the BrJMJ18 transgenic Par plants grown in the greenhouse under different temperature conditions. a BrJMJ18 transgenic Par plants grown under normal conditions (NC) for 9 weeks. Scale bar, 5 cm. b Phenotypes of the BrJMJ18 transgenic Par plants grown under NC conditions for 4 weeks, following another 5 weeks under high temperature (HT) conditions. Scale bar, 5 cm. Red arrows, withered leaves. c Flowering time of plants is shown in (a) and (b). DAS, days after sowing. Data are means ± SD, n = 15. Asterisks indicate significant differences between NC and HT, two-tailed Student’s t-test (***p < 0.001) Par, p = 2.53 × 10⁻⁵; BrJMJ18Par-OX, p = 9.28 × 10⁻⁹. d Confirmation of BrJMJ18 protein expression in the transgenic plants by immunoblotting analysis. Ponceau S staining was used to assess equal loading. e, f Flowering characterizations of BrJMJ18 knockout Par line, BrJMJ18Par-CR, in greenhouse under different temperatures. g Flowering time of plants shown in (e) and (f). Red arrows, withered leaves. Data are means ± SD, n = 15. Asterisks indicate significant differences between NC and HT, two-tailed Student’s t-test (***p < 0.001) Par, p = 2.32 × 10⁻¹⁰; BrJMJ18Par-CR, p = 1.47 × 10⁻¹⁶. The experiments in (a–f) were repeated three times with similar results. h Confirmation of BrJMJ18Par-CR by Sanger sequencing. A single base pair deletion (G → /) at the + 661 position after the ATG leads to a frame-shift mutation of the BrJMJ18 protein. i, j Par, BrJMJ18PC- and BrJMJ18Par-OX plants were planted in a tunnel greenhouse under natural field conditions in the summer (15th, Jul. … 29th, Sept.) of 2021 to simulate extremely high-temperature conditions for flowering time characterization. Data are means ± SD, n = 20. Asterisks indicate significant differences between Par and BrJMJ18Par-OX, two-tailed Student’s t-test (***p < 0.001), p = 8.19 × 10⁻⁵. For box plots (c, g, and j), the box encompasses two middle quartiles, with a central line showing the median. Whiskers extend to the furthest data point within 1.5 times the interquartile range. Source data are provided as a Source Data file.

