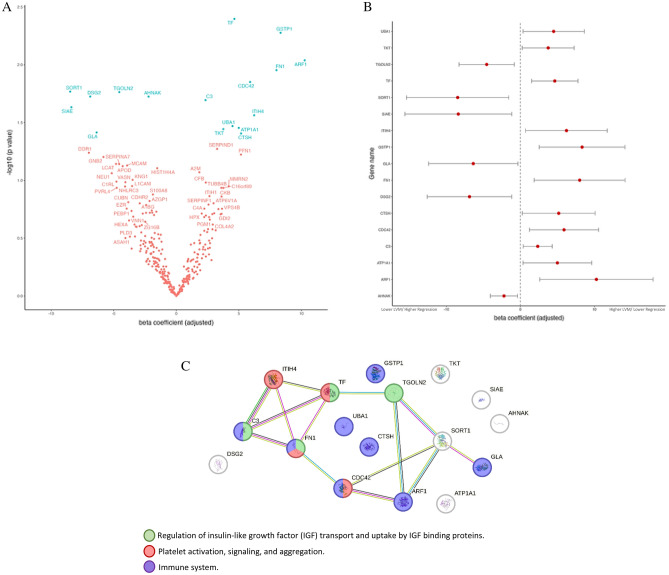
Figure 1.
(A) Volcano Plot from multivariable generalized linear mixed-effects models (adjusted to cardiovascular risk factors, age at recruitment moment, parity, weight gain until 3rd trimester, and evaluation moments) showing the distribution of the proteins according to their effect (beta coefficient) and significance level (− log10(p-value)) regarding LVM regression. Proteins are identified with the respective gene name. Red labels are non-significant associations whereas blue labels signify significant associations. (B) Urine proteins showing a significant association with LVM, according to the GLMM. (C) STRING Protein–Protein interaction network of the 17 most relevant proteins associated with postpartum LVM, according to a GLMM. Each node represents a protein, identified with the respective gene name. The most relevant biological processes found through gene ontology enrichment analysis are depicted through node colors. Each type of protein interaction is represented by a different edge color (cyan: known interaction from curated databases, pink: experimentally determined; yellow: text mining; black: co-expression; green: predicted interaction from gene neighborhood).

