FIGURE 4.

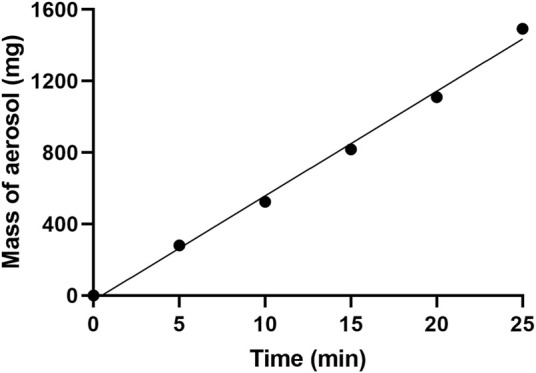
Plot showing the mass of aerosol formation at different time intervals. The R 2 for the line of best fit was found to be 0.9951.

Plot showing the mass of aerosol formation at different time intervals. The R 2 for the line of best fit was found to be 0.9951.