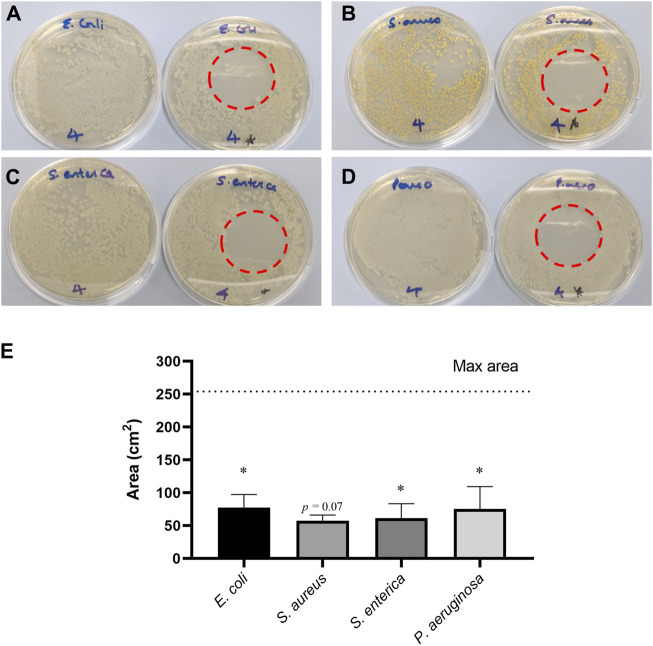
FIGURE 7.
A photographic representation of the plates obtained for Escherichia coli (A), S. aureus (B), S. enterica (C) and Pseudomonas aeruginosa (D), showing a control plate (left) and the no growth zone obtained on a plate that was directly exposed to PAAs for 15 min (right). Zones of no growth (E) after direct exposure to PAAs for 15 min were significant. Data is presented as mean (±S.D.) for two biological replicates (n = 2). Statistical comparison was done between samples means and untreated control (max area), where significant data is marked with *p ≤ 0.05. When 0.05 < p ≤ 0.1, value is indicated.

