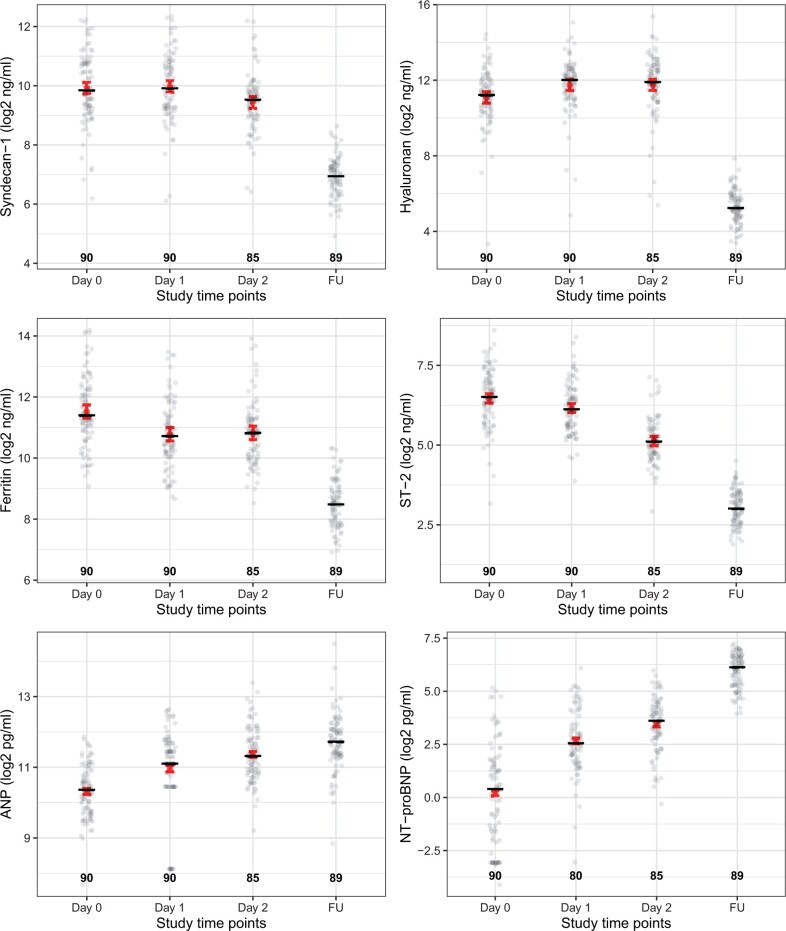
Figure 1.
Serial measurements of cardiovascular and inflammatory biomarkers in patients with dengue shock patients during ICU admission and at the follow-up visit. All biomarker levels are transformed using log-2. The study timepoints were day 0—at presentation of shock, day 1, day 2, and at the FU (7–10 days after PICU discharge). Dots represent individual values in each group. The number represents the number of patients that contributed to each group. Short black line represents the median value of biomarkers during each study timepoint. The red point and error bars represent the predicted mean with its 95%CI calculated from the linear mixed effect models with the log 2 of plasma values of each biomarker (excluding values at follow up) as the outcome, the study timepoint as a categorical covariate, adjusted for day of illness at presentation with shock. ST-2, suppression of tumourigenicity 2; ANP, atrial natriuretic peptide; NT-proBNP: N-terminal pro brain natriuretic peptide

