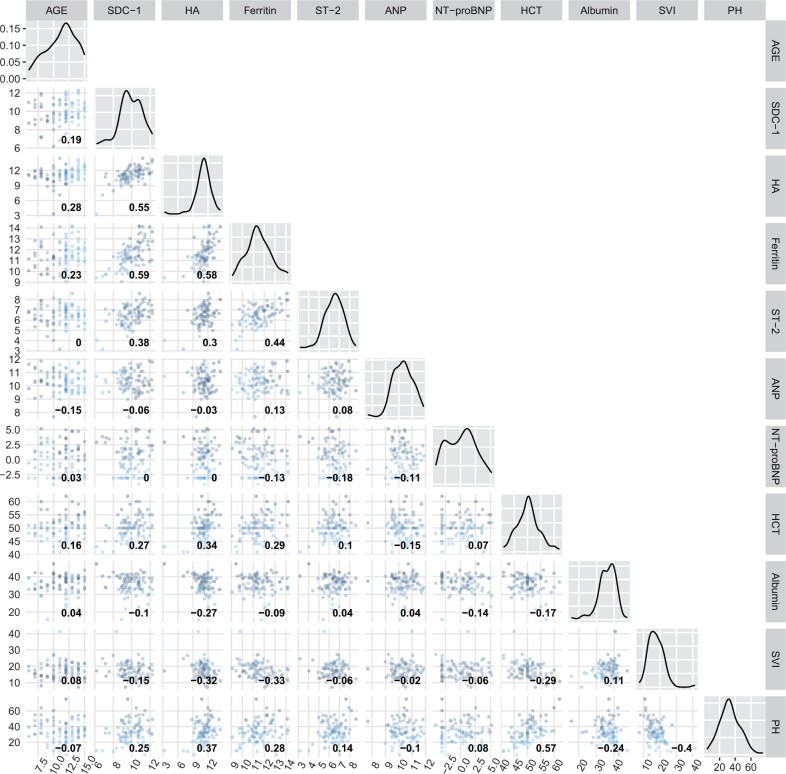
Figure 3.
Pairwise correlation of biomarkers levels and markers of vascular leakage in DSS patients at presentation with shock. All biomarker levels are transformed using log-2. The red line is the linear regression line, and the gray region is the 95% confidence interval. The number inside each scatter plot represents the Spearman’s rank correlation coefficient of the two variables at the corresponding column and row. When the column and row refer to the same variable, the corresponding scatter plot is replaced by a density plot to reflect the distribution of that biomarker. Percentage haemoconcentration was calculated as (enrolment—FU haematocrit/FU haematocrit)*100. SDC-1: Syndecan-1, HA: Hyaluronan, ST-2: suppression of tumourigenicity 2; ANP: atrial natriuretic peptide; NT-proBNP: N-terminal pro brain natriuretic peptide, HCT: haematocrit, SVI: Stroke volume index, PH: Percentage haemoconcentration

