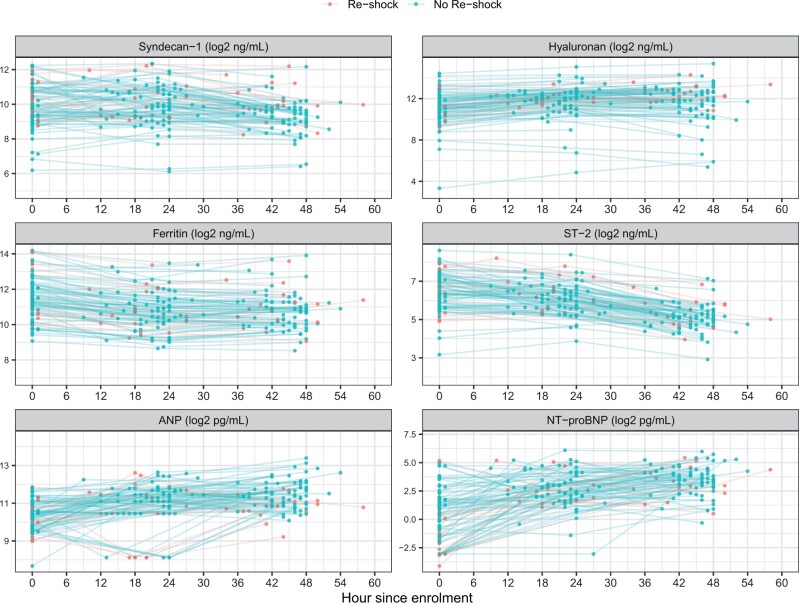
Figure 4.
Kinetics of biomarker levels by individual during ICU admission, stratified by recurrent shock. All biomarker levels are transformed using log-2. Each coloured dot represents a biomarkers value. Coloured lines are changes of biomarker values for each patient. ST-2, suppression of tumourigenicity 2; ANP, atrial natriuretic peptide; NT-proBNP, N-terminal pro brain natriuretic peptide

