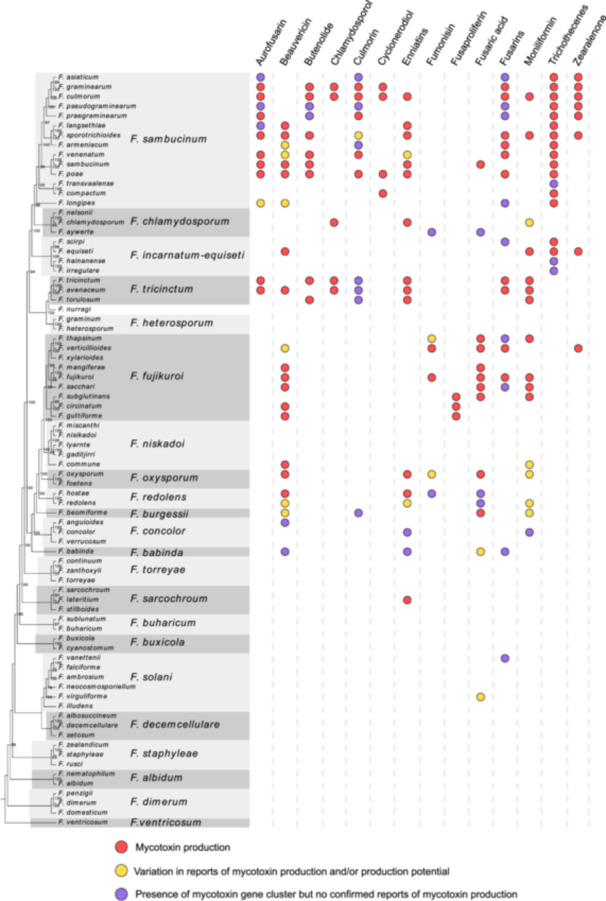
Figure 2.

The varieties of mycotoxin production in Fusarium species. On the left side, the cladogram depicts phylogenetic relationships among the chosen set of Fusarium species. On the right side, the circle represents the mycotoxin production abilities of Fusarium species. The cladogram was constructed by maximum likelihood analysis using the RPB1 + RPB2 dataset described by O'Donnell et al. 16 in RAxML 8.2.10. Support for branches was determined through bootstrap analysis (1000 replicates), and only values of more than 60 are shown. The distribution of mycotoxin production was based on the work of Munkvold et al. 11 . White space indicates that there are no chemical or genetic evidence for mycotoxin production.
