Figure 6.

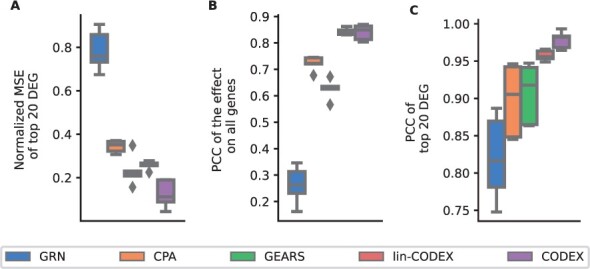
Reconstruction performance in terms of normalied MSE for the top 20DEGs (A), PCC of the effect on all genes (B) and PCC of the top 20 DEGS (C) of unseen perturbation combinations on the Norman et al. (2019) data.

Reconstruction performance in terms of normalied MSE for the top 20DEGs (A), PCC of the effect on all genes (B) and PCC of the top 20 DEGS (C) of unseen perturbation combinations on the Norman et al. (2019) data.