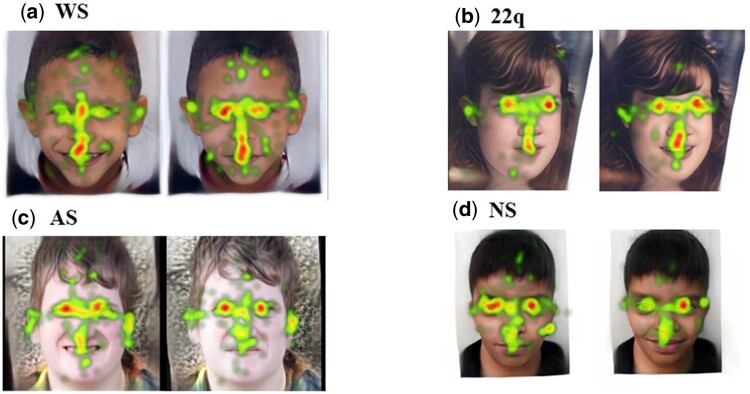
Figure 2.
Example outputs of the eye-tracking experiment. Each image illustrates the visual heatmap averaged over 10 clinicians. Each set of images includes the reconstructed image (left) and its corresponding expression-manipulated version (right). All appropriate permissions have been obtained to reuse images and the citations for each are provided in Supplementary Table 5.

