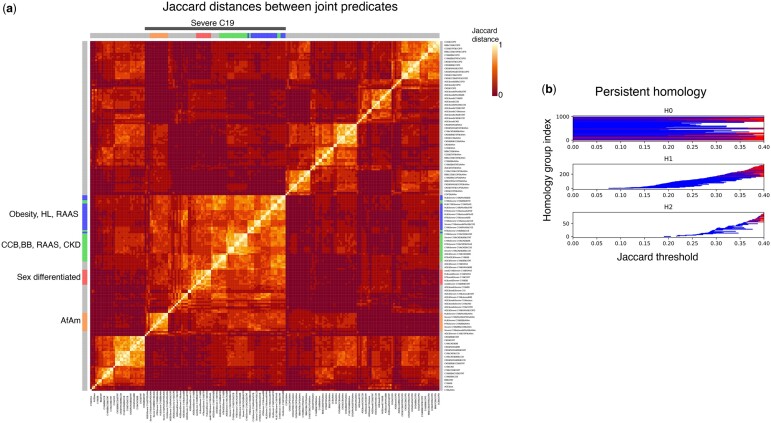
Figure 3.
(a) Jaccard distances between joint predicates. Severe C19 cluster is indicated with a gray bar (top). The primary homologous subclusters are indicated in blue, green, red, and orange. (b) Barcode plots for the Jaccard distances shown in panel (a). Abscissa is Jaccard threshold. Ordinate is homology group index ranked by Jaccard filtration threshold. The groups H0, H1, and H2 refer to dimensions 0, 1, and 2.

