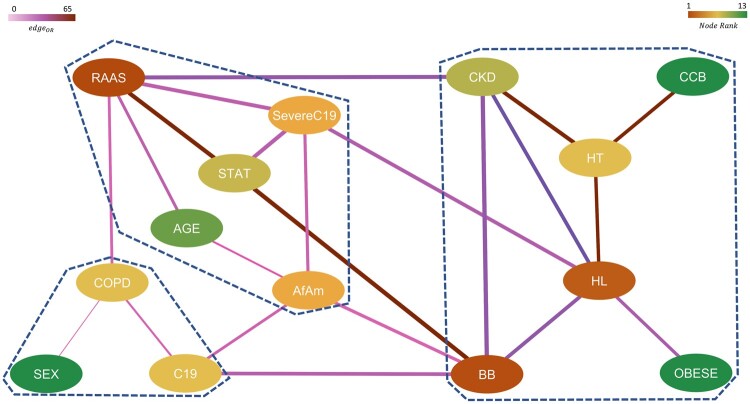
Figure 6.
Network representing significant, higher-order interactions between different features with nodes colored by their relative rank (gradient of brown to green corresponds to higher to lower rank) and edges colored by their respective pairwise odds ratios (gradient of light to dark corresponds to low to high OR) and edge width indicates the strength of the connection between them. The communities obtained from this network are marked by dashed lines.

