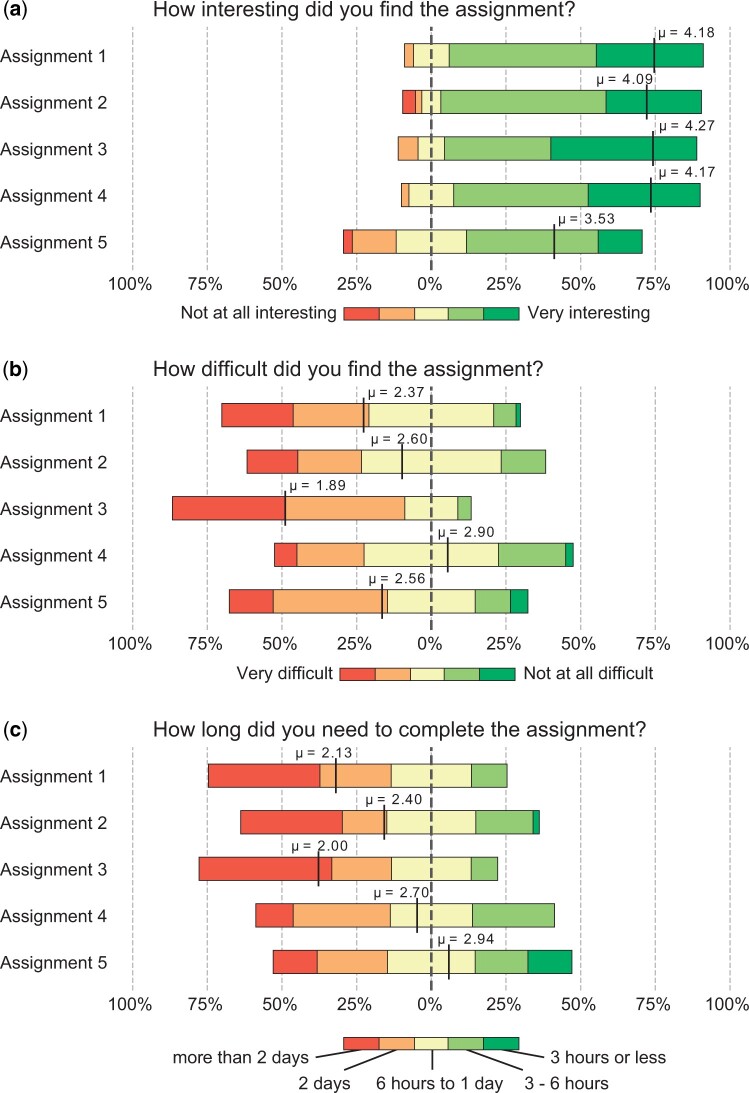
Figure 5.
Student feedback. We plot the distributions of student responses related to assignment interestingness, difficulty, and time spent to complete the assignment. Each distribution is centered to the neutral response. To facilitate comparisons between the different assignments, we mark the distribution means, which are obtained by assigning 1 to the red option and 5 to the green option, and the intermediate options accordingly.

