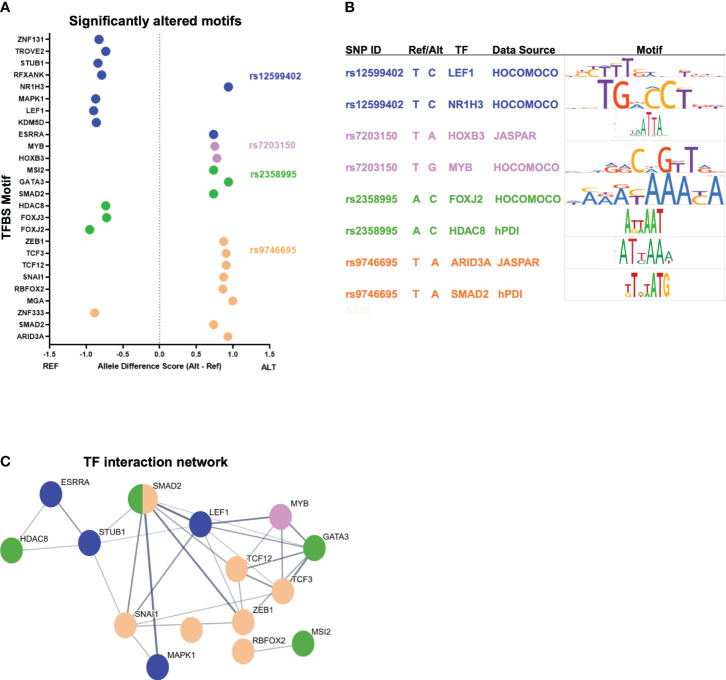
Figure 2.
T1D enhancer SNP-associated transcription factor network. (A) Top-scoring TF motifs altered by the T1D enhancer variants. (B) Example motifs for each variant shown. (C) Protein–protein interactions for TFs associated with each T1D enhancer variant. The hub colors correspond to the variant colors in (A, B).

