
Figure 4.
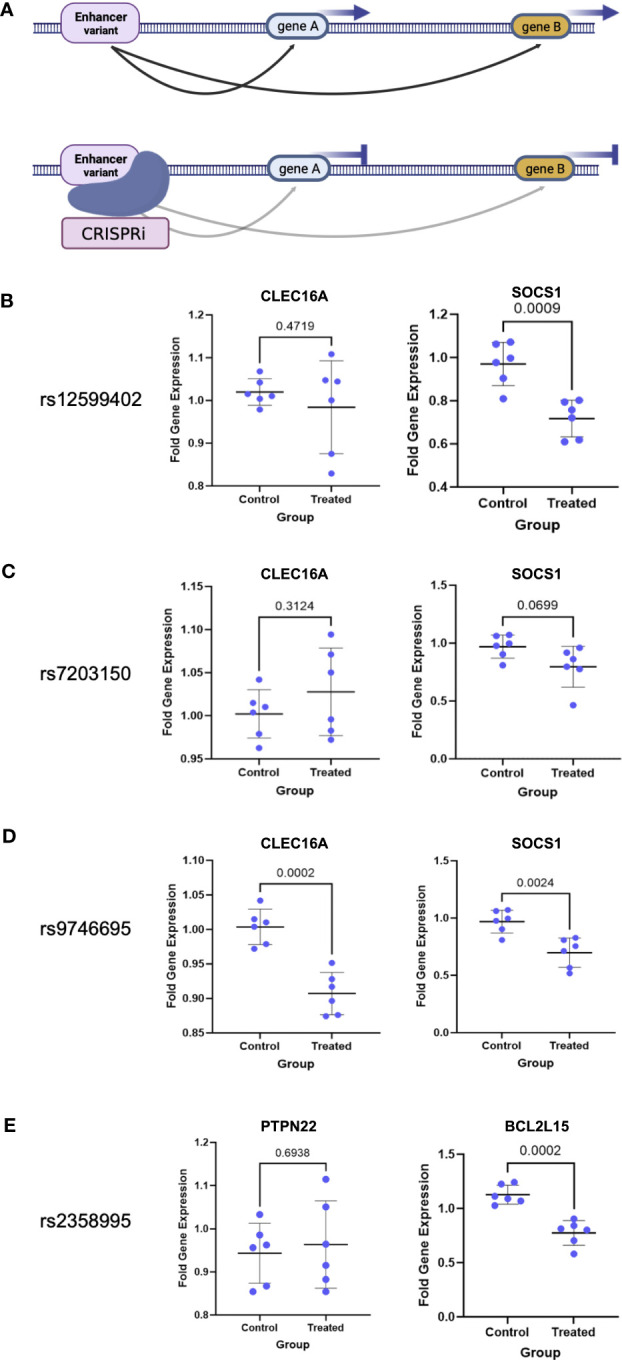
CRISPRi validation of enhancer–target gene interactions. (A) Schematic of enhancer interaction and CRISPRi effect on a true target gene. (B–E) Enhancer target gene expression level after enhancer (treated) repression by CRISPRi or using nontargeting guides (control). p-values are indicated above the line in each comparison.