. 2024 May 16;6(3):e230196. doi: 10.1148/ryct.230196

Figure 5:

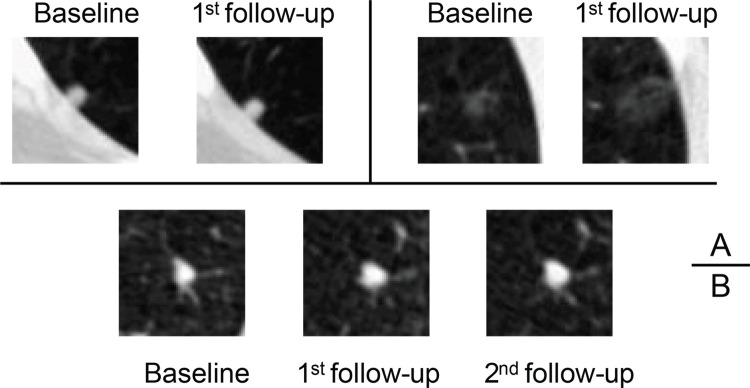
Axial low-dose CT images show examples of nodules without contrast media with different margins and internal characteristics classified by the serial-year radiomics-based reinforcement learning (S-RRL) model and the Brock model at baseline screening examination. (A) The S-RRL model correctly diagnosed three benign nodules as low risk (underwent 2 years of follow-up scans) (true negatives), while the Brock model mistakenly identified them as high or medium risk (false positives). (B) Three benign nodules were mistakenly identified as high risk (false positives) by both models. (C) Three malignant nodules were correctly diagnosed as high risk by the S-RRL model (true positives), but the Brock model diagnosed them as medium risk (false negatives). (D) Three malignant nodules were mistakenly identified as medium risk by both models (false negatives). GGO = ground-glass opacity.

Axial low-dose CT images show examples of nodules without contrast media with different margins and internal characteristics classified by the serial-year radiomics-based reinforcement learning (S-RRL) model and the Brock model at baseline screening examination. (A) The S-RRL model correctly diagnosed three benign nodules as low risk (underwent 2 years of follow-up scans) (true negatives), while the Brock model mistakenly identified them as high or medium risk (false positives). (B) Three benign nodules were mistakenly identified as high risk (false positives) by both models. (C) Three malignant nodules were correctly diagnosed as high risk by the S-RRL model (true positives), but the Brock model diagnosed them as medium risk (false negatives). (D) Three malignant nodules were mistakenly identified as medium risk by both models (false negatives). GGO = ground-glass opacity.