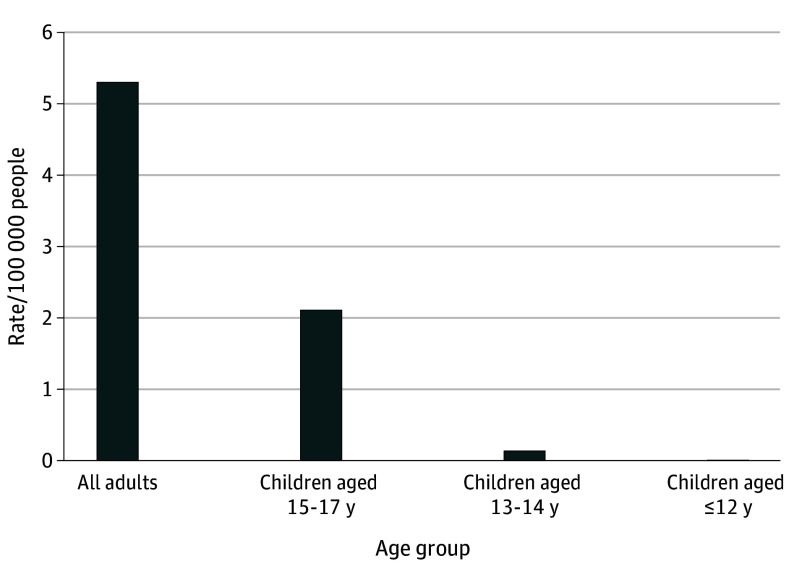
Figure 1. Rates of Gender-Affirming Surgical Procedures Associated With a Transgender and Gender Diverse (TGD)-Related Diagnosis per 100 000 People in 2019.
Each bar represents the number of people in each age group who received a gender-affirming surgery associated with a TGD-related diagnosis, per 100 000 total people in that age group in 2019.

