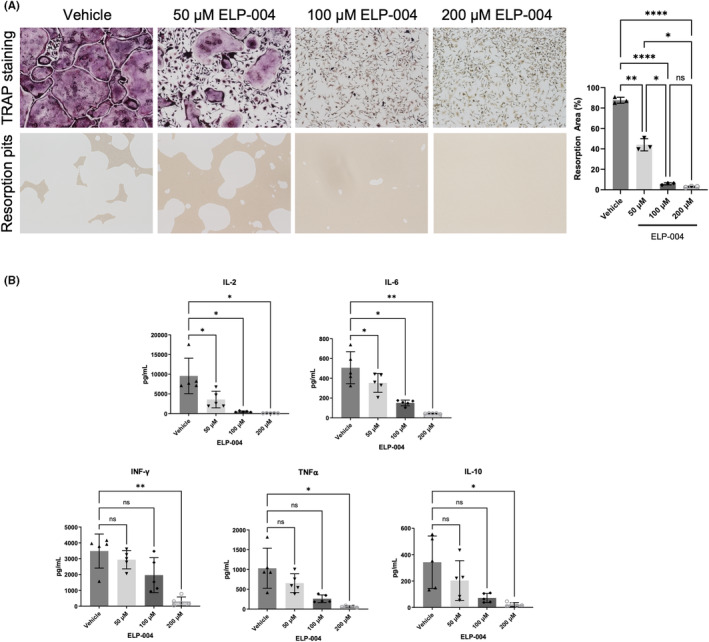
FIGURE 3.

(A) Monocytes were isolated from the bone marrow of male DBA/1 mice (n = 3). Cells were stimulated with RANKL and mCSF and treated with escalating doses of ELP‐004 ex vivo. Cells were stained for the TRAP expression (top) or plated on matrix‐coated plates to assess bone resorption activity (bottom). Area of resorption pits was quantified (right). Groups were analyzed using repeated measures ANOVA with the Geisser–Greenhouse correction; multiple comparisons were performed using Tukey's post hoc test. (B) Single cell suspensions of splenocytes were prepared from male DBA/1 mice (n = 5). T cells were stimulated ex vivo with anti‐CD3 and anti‐CD28 and treated with increasing doses of ELP‐004. Secreted cytokines were assessed using a multi‐analyte ELISA (MSD plate). Cytokine concentrations were using compared using repeated measures one‐way ANOVA with a Dunnett post hoc test for multiple comparisons. Data are presented as mean ± SD. *p < .05; **p < .01; ****p < .0001.
