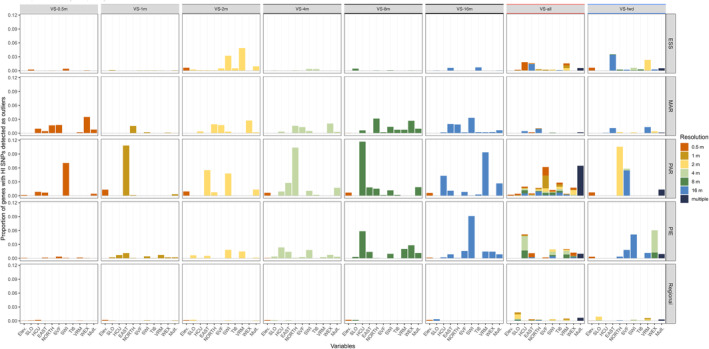
FIGURE 2.

The proportion of high‐impact genes with outlier SNPs for the four sites (ESS, MAR, PAR, PIE) separately (local) and grouped (regional), grouped by the variable sets used as explanatory variables in the RDA models (columns). The x‐axis shows the associated variables, colored by the spatial resolution (grain size) for the variable. In cases where a gene had multiple SNP–variable associations, this was listed as “multiple”. Descriptions of variable sets found in Table S1. See Table S9 for raw counts of high‐impact SNP–variable associations in each gene.
