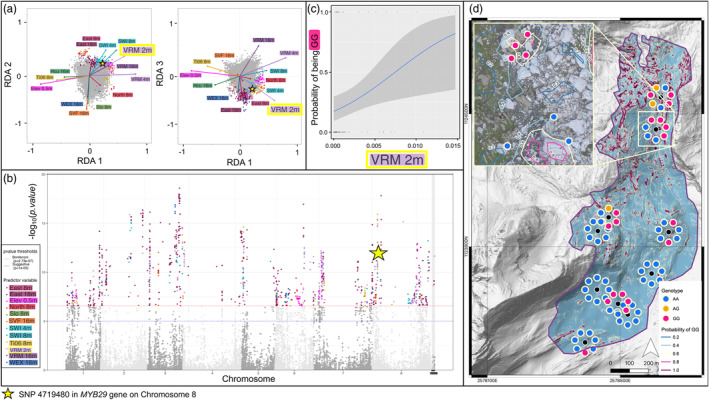
FIGURE 3.

An example at study site Essets (ESS) to illustrate how a GEA model built with forward‐selected variables (VS‐fwd) can be used to detect a candidate SNP under selection and associate it with a given environmental variable (VRM at 2 m). Biplots (a) show the loading distribution of SNPs (points; multiplied by 20 to ease visualization) and environmental variables (arrows) across the first three RDA axes, where the projections in the RDA space were used to assign each outlier locus to the predictor variable with the largest absolute scalar value. The outlier loci are color‐coded to the most associated predictor variable of the same colored label. The location and significance of SNPs across the genome was visualized with a Manhattan plot (b), where outlier SNPs are color‐coded by their associated variable. In this example, locus 4719480 in the Aa_G76360.h1 gene of the MYB29 complex on chromosome 8 (indicated by yellow star in (a) and (b)) was most strongly influenced by VRM at 2 m. The logistic regression between the GG genotype at this locus with VRM at 2 m (c) was used to calculate the probability of finding the GG genotype across the ESS (d).
