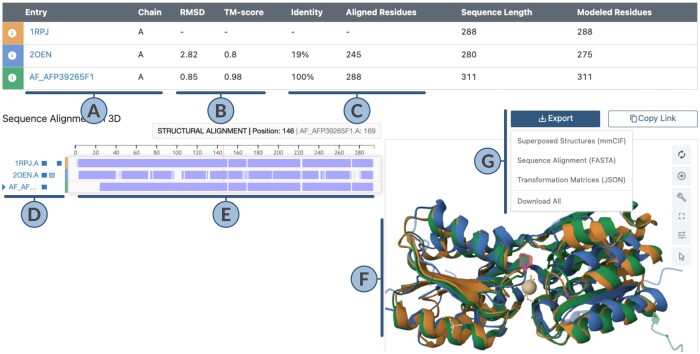
Figure 1.
Output of the pairwise alignment application. (A) Summary of aligned chains. (B) 3D Structure-based scores (Root-Mean-Square-Deviation or RMSD in Ångstrom Units; TM-score, range 0.00–1.00). (C) Sequence-based scores (% identity, number of aligned residues). (D) Toggle visibility of aligned chain, all polymers, and all ligands via 1st, 2nd, and 3rd box buttons, respectively. (E) Structurally aligned sequence regions in a darker shade, regions aligned only at sequence level in a lighter shade, non-aligned gaps are left empty. (F) 3D visualization of aligned structures. (G) Tools to export and share alignment.

