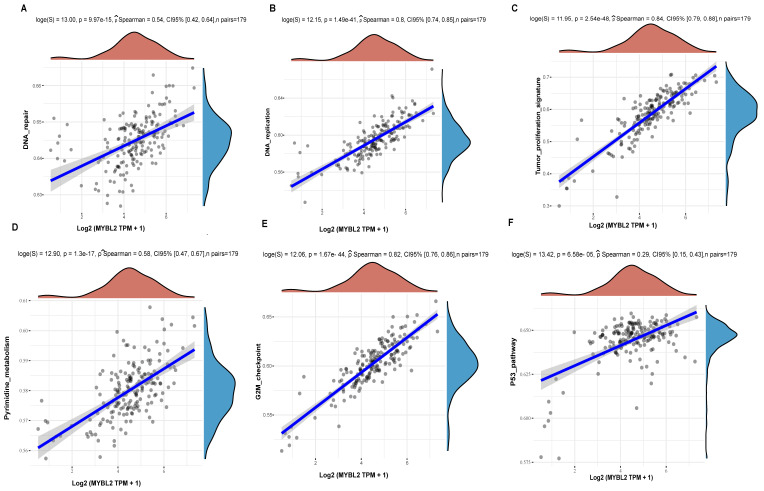
Figure 7.
The correlations between MYBL2 gene and pathway score was analysed with Spearman. The abscissa represents the distribution of the gene expression, and the ordinate represents the distribution of the pathway score. (A)The correlations analysis between MYBL2 gene and DNA repair pathway. (B)The correlations analysis between MYBL2 gene and DNA replication pathway. (C) The correlations analysis between MYBL2 gene and tumor proliferation pathway. (D)The correlations analysis between MYBL2 gene and pyrimidine metabolism pathway. (E) The correlations analysis between MYBL2 gene and G2M checkpoint pathway. (F)The correlations analysis between MYBL2 gene and p53 pathway.

