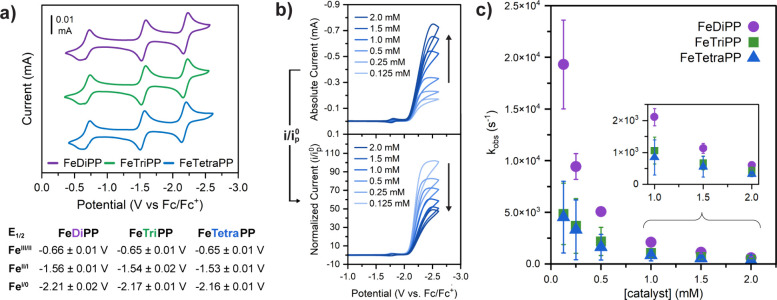
Figure 3.
Electrochemical and catalytic studies. (a) Cyclic voltammograms of FeDiPP, FeTriPP, and FeTetraPP. Conditions: 1.0 mM catalyst, 0.1 M TBAPF6 in Ar-saturated DMF using a glassy carbon electrode, and 100 mV/s scan rate. Below: mean reduction potentials (vs Fc/Fc+) from three independent CV measurements; errors are 1 standard deviation. (b) Catalyst concentration-dependent CVs (top plot) and CVs normalized by i0p, the peak current of the FeII/I peak (bottom plot) of FeTetraPP. (c) Mean observed rate constants (kobs) as a function of catalyst concentration for each iron porphyrin based on three independent CV measurements; error bars represent 1 standard deviation. Conditions: indicated catalyst concentration, 250 mM PhOH, 0.1 M TBAPF6 in CO2-saturated DMF, and 100 mV/s scan rate.

