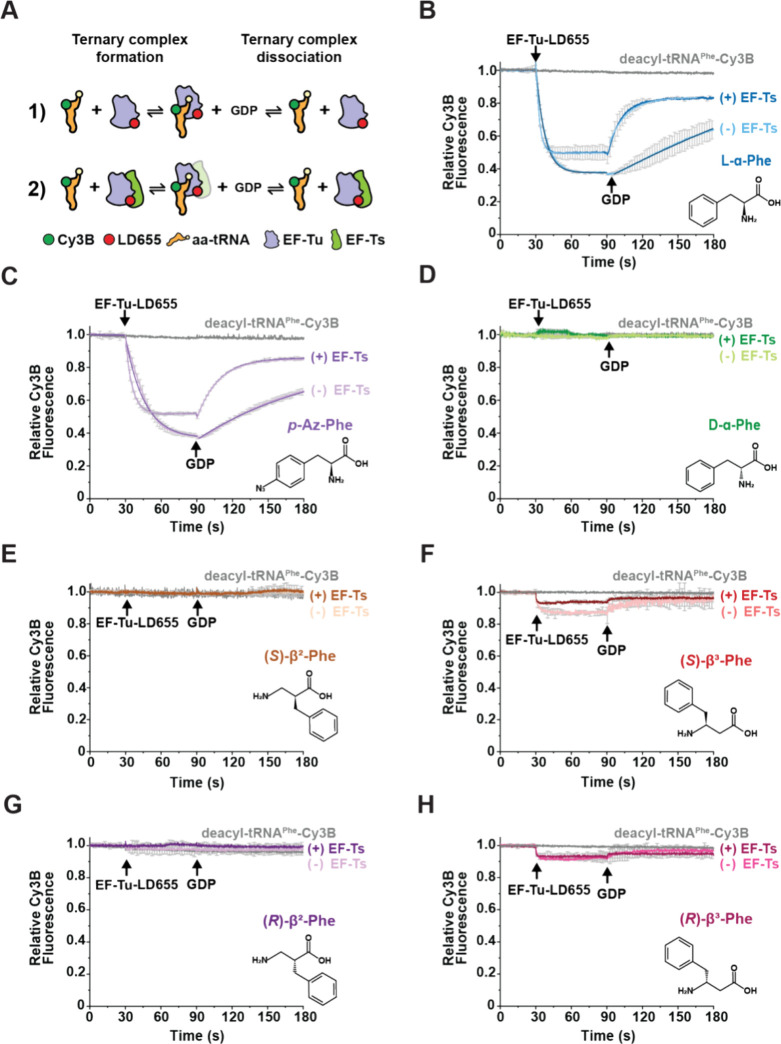
Figure 2.
Ensemble FRET-based assay to measure ternary complex formation and dissociation. (A) Cartoon schematics of the FRET-based ensemble ternary complex formation assay, where LD655-labeled EF-Tu (blue) (1) without or (2) with EF-Ts (green) (400 nM) is injected into a cuvette containing 5 nM aa-tRNAPhe-Cy3B (orange) in the presence of 10 μM GTP. Formation of ternary complex results in rapid quenching of Cy3B fluorescence via FRET that can be recovered upon dissociation after injection of 100 μM GDP. In (2), due to the experimental conditions used (labeling strategy and 100 ms time resolution), the transient formation of the previously reported quaternary complex (EF-Tu/Ts·GTP·aa-tRNA) could not be observed. (B–H) Ensemble ternary complex assays tracking Cy3B relative fluorescence changes over time upon mixing LD655-labeled EF-Tu (+ EF-Ts), and subsequent addition of GDP, with tRNAPhe-Cy3B aminoacylated with (B) l-α-Phe, (C) p-Az-Phe, (D) d-α-Phe, (E) (S)-β2-Phe, (F) (S)-β3-Phe, (G) (R)-β2-Phe, and (H) (R)-β3-Phe. Monomer structures are shown to the right of each plot. Plots represent mean ± SD from two experimental replicates.

