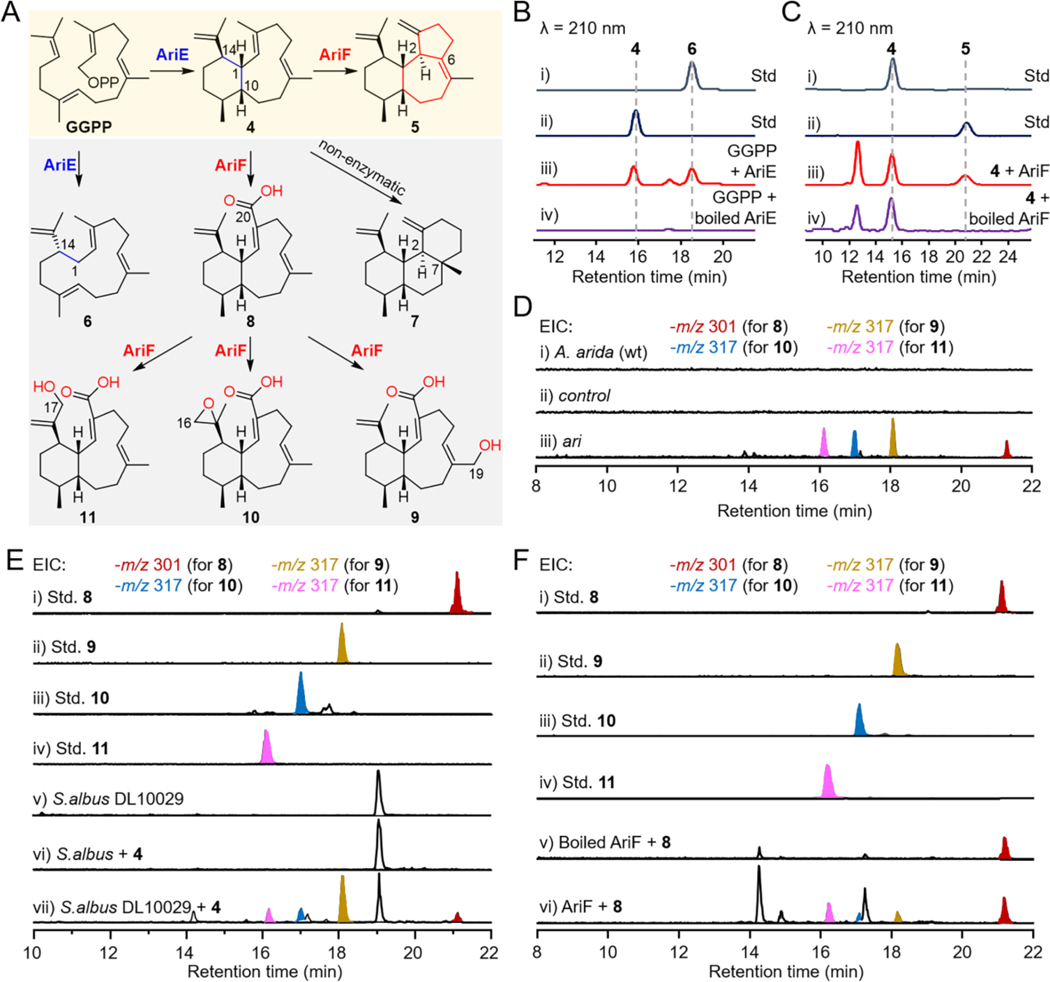
Figure 3.
Biochemical characterization of TC AriE and P450 AriF. (A) The comprehensive functions of AriE and AriF. The almond area represents the native pathway of ari BGC, while the blanched light grey area represents a shunt pathway. (B) HPLC profiles of the in vitro reactions of AriE with GGPP. (C) HPLC profiles of the in vitro reactions of AriF with benditerpe-2,6,15-triene (4) and the redox partner CamA/CamB. (D) EIC (m/z 301 and 317; negative mode) analysis of metabolites from S.lividans DL10011. S.lividans TK64 with empty pSET152 was used as a control. (E) EIC (m/z 301 and 317; negative mode) analysis of S.albus DL10029 (harboring ariF) that was supplemented with 4. (F) EIC (m/z 301 and 317; negative mode) analysis of the in vitro reaction of AriF with 8 and the redox partner FdR/Fdx.

