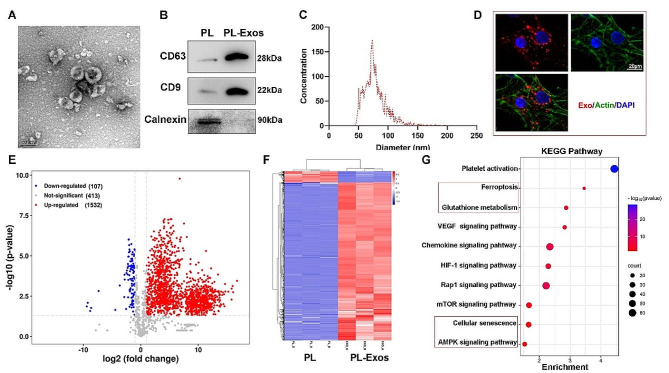
Fig. 2.
Characterization of platelet-derived exosomes. (A) Images of PL-Exos observed under a transmission electron microscope. Scale bar: 200 nm; (B) Western blot analyses of particular surface markers, including CD9, CD63 and calnexin. (C) NTA observation of the diameter distribution of isolated PL-Exos. (D) Fluorescence image of DIL-labeled exosomes (red) absorbed by TSPCs. F-actin was stained with phalloidin (green), and the nuclei were stained with DAPI (blue). Scale bar: 20 μm. (E) Volcano plot of differentially expressed proteins in PL-Exos versus platelet lysate; (F) Heatmap of the protein levels of the differentially expressed proteins; (G) KEGG analysis of proteins in PL-Exos compared to those in PL-Exos; (H) β-gal staining of TSPCs; ∗p < 0.05, ∗∗p < 0.01

