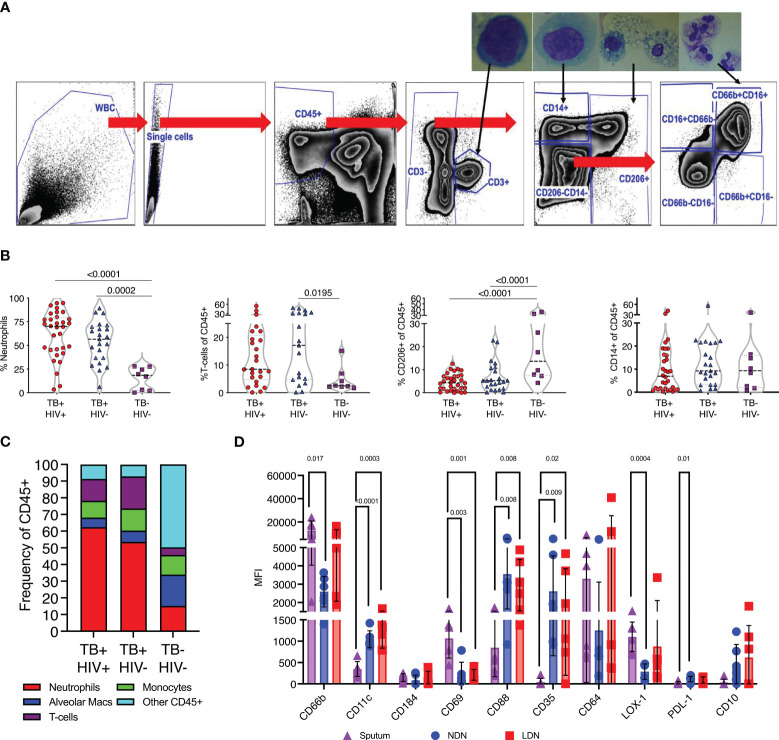
Figure 4.
TB associated with high neutrophil abundance in sputum. (A) Flow gating strategy for identifying cell sub-sets within fresh sputum samples. Each of the main subsets was sorted using a FACS ARIA cell sorter and sorted cells spun on to microscope slides using a cytospin for visual confirmation of appropriate morphology, as shown. (B) The relative abundance of CD66b+ neutrophils, CD3+ T-cells, CD206+ alveolar macrophages and CD14+ monocytes. Significant differences indicated by p-values, by Kruskal-Wallis test. (C). A summary of the average cellular make of sputum samples from TB+HIV-, TB+HIV+ and TB and HIV uninfected controls. (D) Phenotypic characteristics of sputum neutrophils compared to NDN and LDN from matched blood samples from Non-TB Non-HIV infected controls, significant difference shown by p-value (Kruskal-Wallis).

