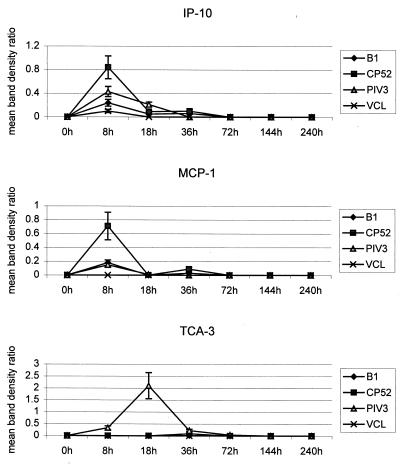
FIG. 2.
Mean band density ratios for IP-10, MCP-1, and TCA-3 mRNA expression. mRNA was isolated from BAL cells collected from 4 to 6 mice/time point during three or more separate experiments with CP52-, B1-, or PIV-3-infected or naïve mice. Chemokine mRNA expression was quantified using a PhosphorImager to determine band densities. The band density ratio was determined by dividing the mean band density of the L32 housekeeping gene by the mean band density of the chemokine. Error bars, standard errors of the means.

