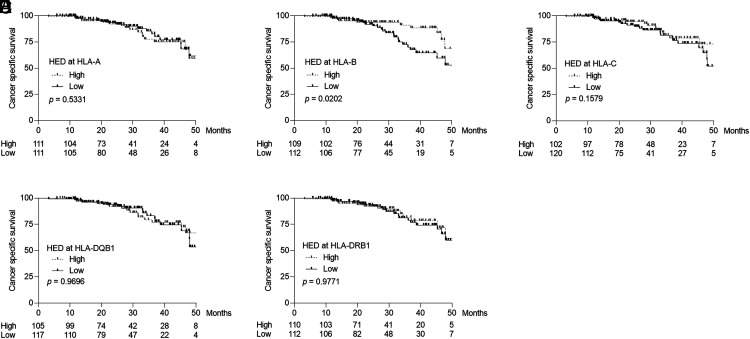
FIGURE 2.
Kaplan–Meier survival analysis of CSS, stratified by the HED at each HLA locus. CSS stratified by the HED at the HLA-A (A), HLA-B (B), HLA-C (C), HLA-DQB1 (D), or HLA-DRB1 (E) loci. The threshold of the HED at each HLA locus was defined as the median. High was defined as having a value greater than the median, and low was defined as having a value less than or equal to the median. Survival analysis was performed using the Kaplan–Meier method and the log-rank test.

