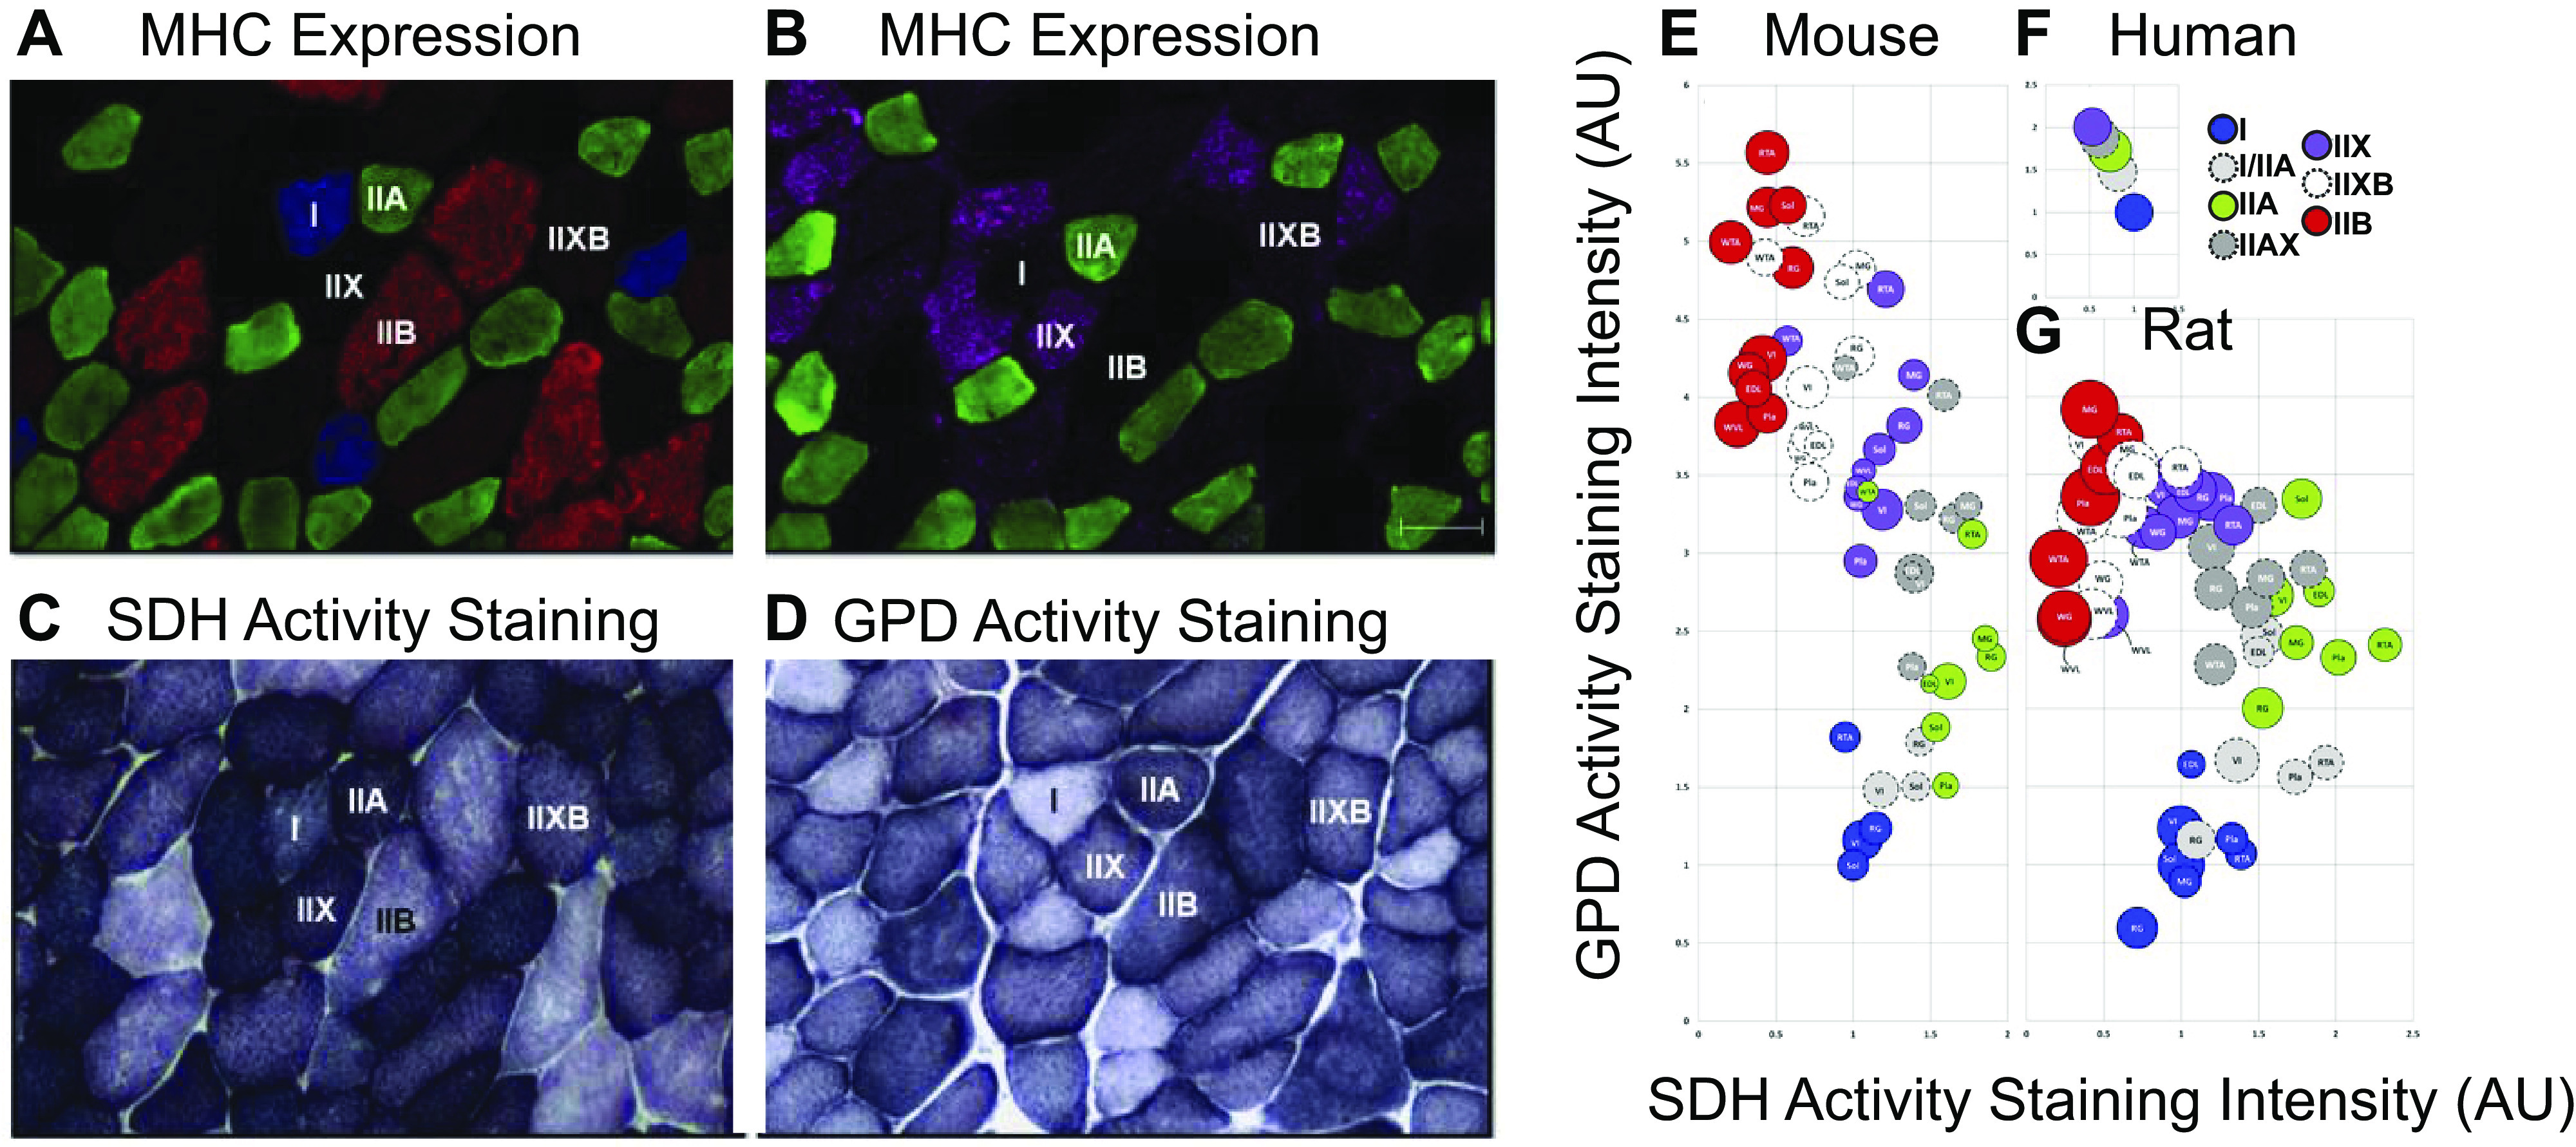
Figure 3.

Representative images of mouse gastrocnemius muscle showing myosin heavy chain (MHC) expression (A and B) as well as succinate dehydrogenase (SDH) activity staining (C) and glyceraldehyde-3-phosphate dehydrogenase activity (GPD) staining (D). Bubble plots (E–G) show SDH activity, GPD activity, and cross-sectional area (CSA) for each fiber type in mouse, rat, and human skeletal muscles. Bubble size represents the relative CSA within a species. SDH and GPD activity are expressed relative to the values obtained in type I fibers (soleus for mouse and rat, vastus lateralis for human) and assigned a reference value of 1.0. There are significant variations and overlap between characteristics of fibers across experiments, species, and muscles. Adapted from Bloemberg et al. (90).
