
Fig. 1. L. monocytogenes replicate exponentially in SVEC4–10 cells despite inefficient invasion.
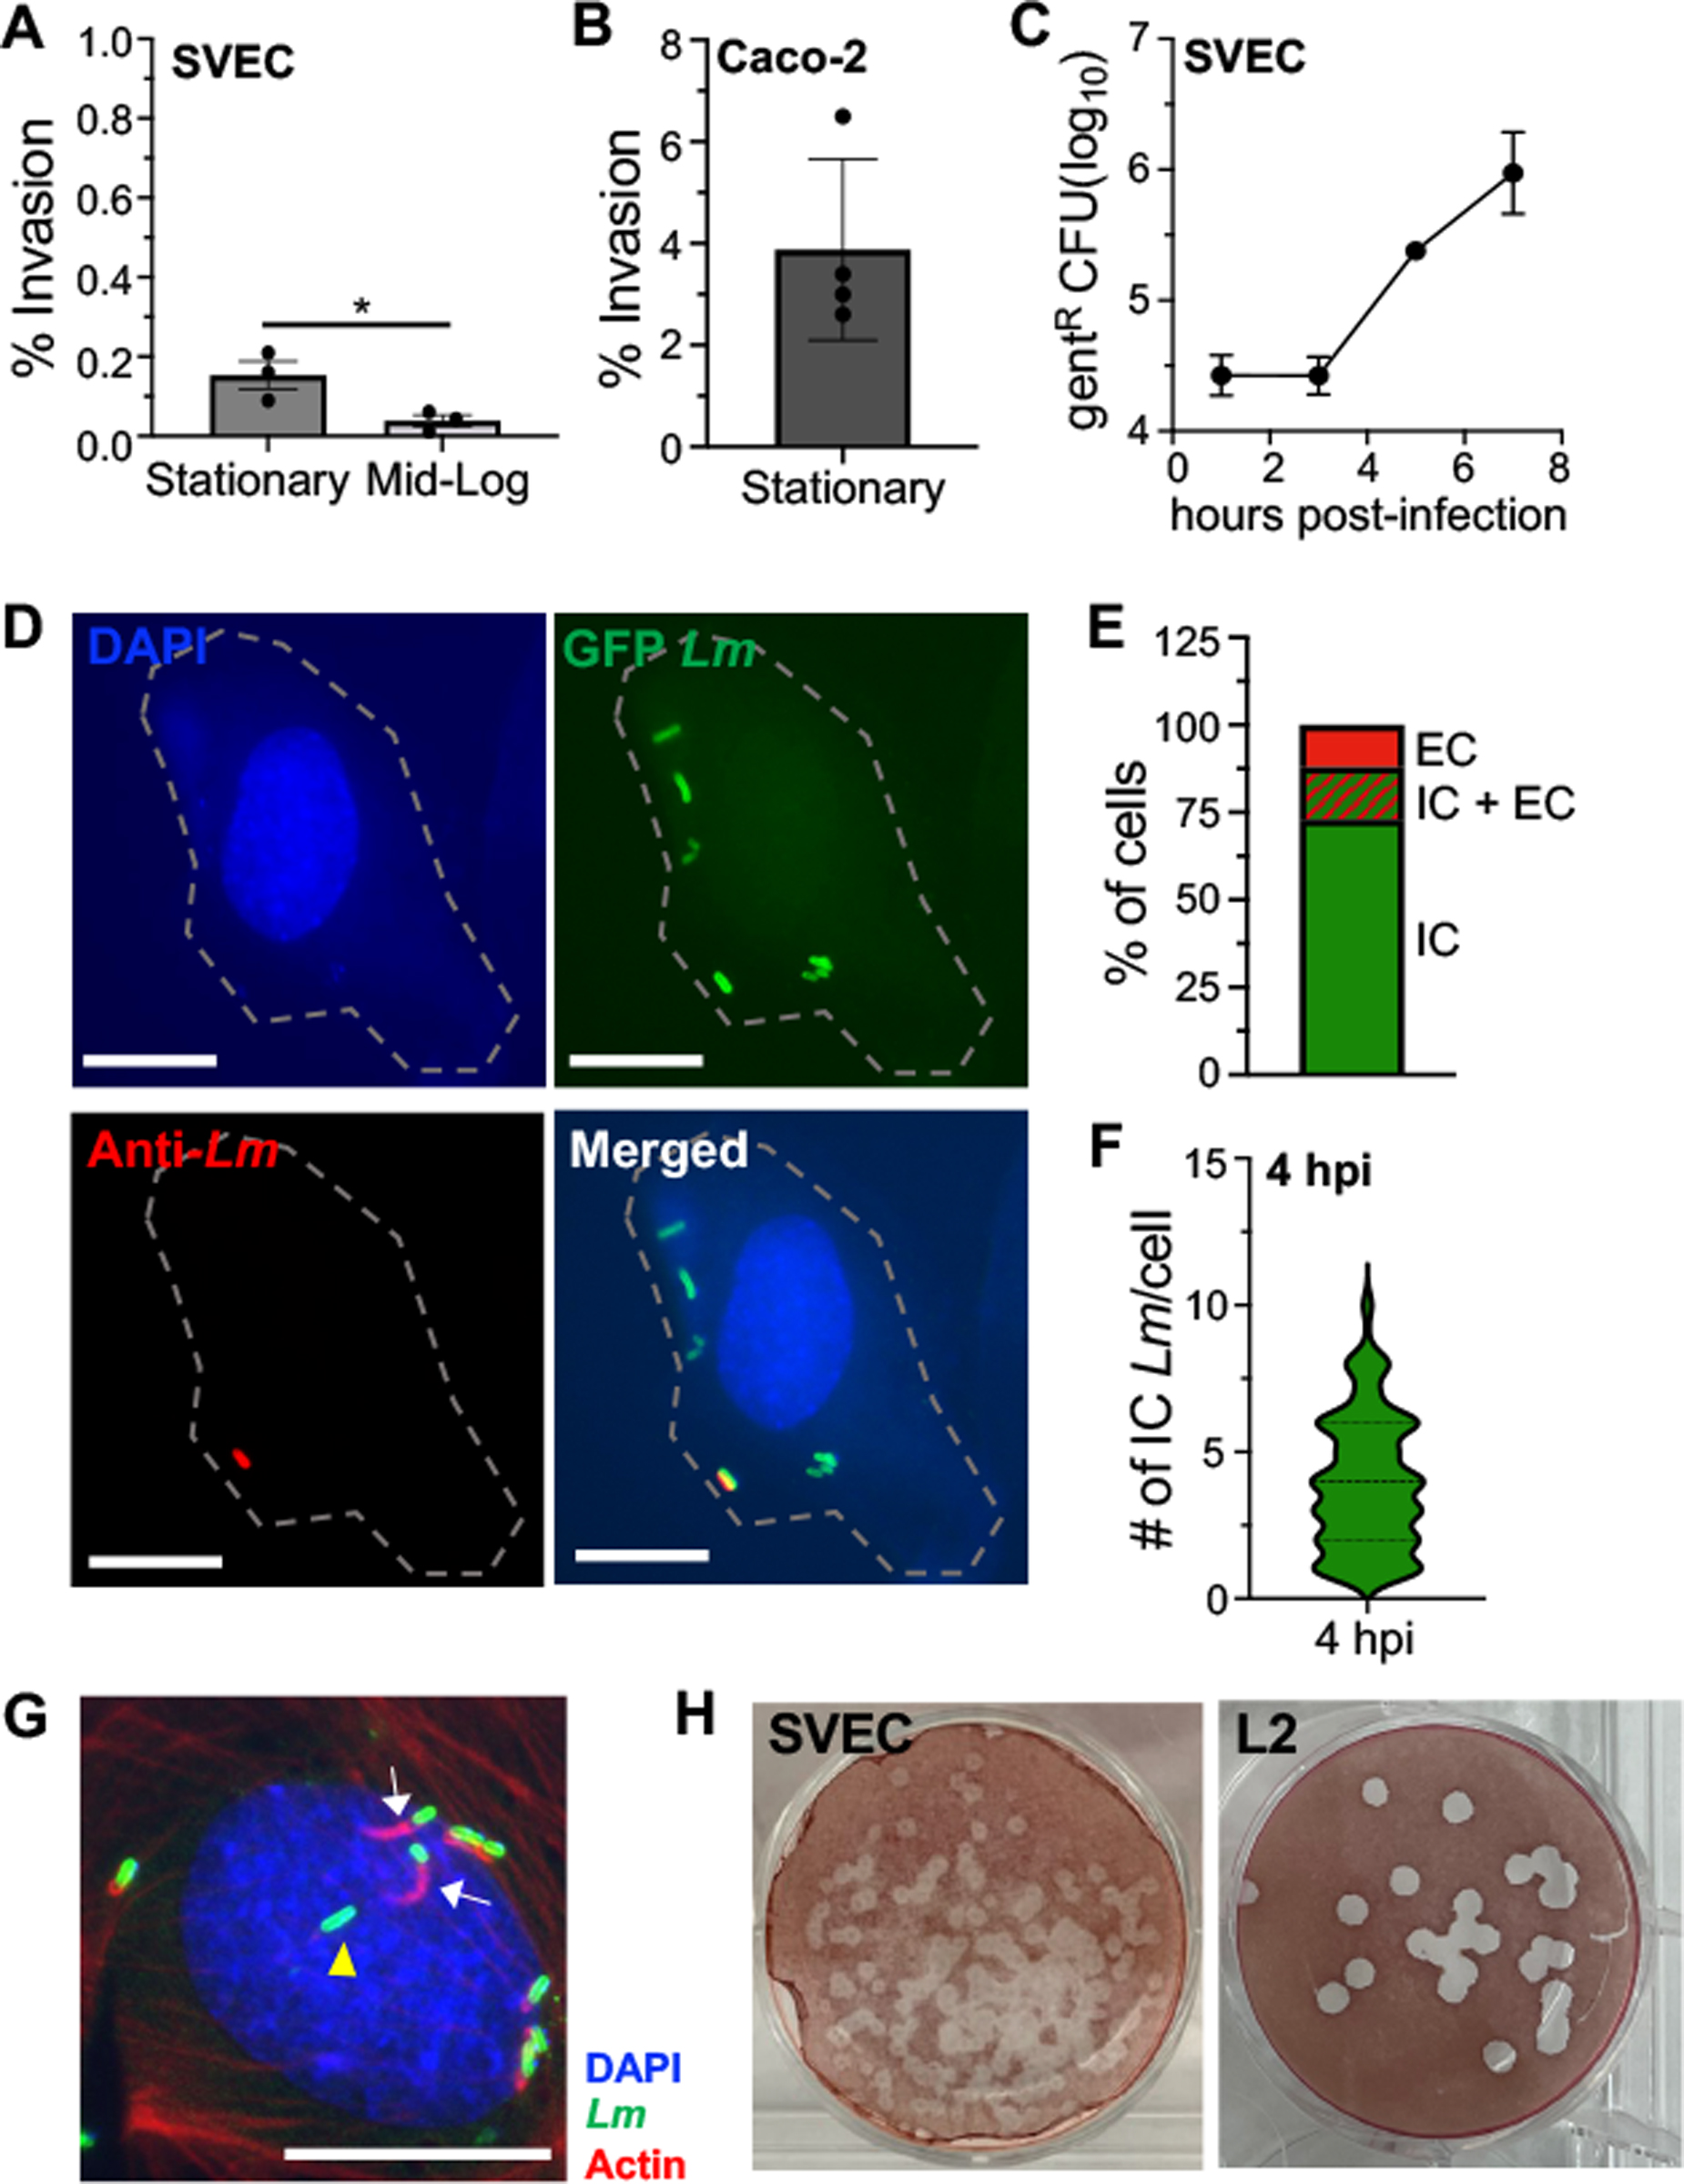
SVEC4–10 cells were infected with L. monocytogenes (Lm) at MOI=10. (A-B) Mean percentage (analyzed by Mann-Whitney) of Lm SD2000 inoculum that was gentamicin-resistant 1 hr post-infection (hpi) in (A) SVEC4–10 cells or (B) Caco-2 cells. (C) Intracellular growth assay using stationary phase Lm SD2000. For panels A and C, mean values (±SEM) for triplicate samples from one of two experiments is shown. For panel B, mean values (±SEM) for quadruplet samples from one experiments is shown. (D) Representative images for differential “in/out” staining of cells infected with stationary phase Lm SD2710 (constitutive GFP), fixed at 4 hpi, and stained with DAPI (nucleus/blue), and anti-Listeria antibody (Lm/red). Scale bar, 5 μm. Dashed line indicates the outline of infected cell from the brightfield image. (E) Stacked bar indicates the percentage of Lm-infected cells (n=300) with only intracellular bacteria (IC), both intracellular and extracellular (IC+ EC), or only extracellular bacteria (EC). (F) Violin plot indicates the number of intracellular Lm observed per cell (n=300). For panels C, D and E data from one of two independent experiments are shown. (G) Representative image for phalloidin staining of SVEC4–10 cells infected with Lm SD2710 at 4 hpi; white arrows indicate Lm associated with actin; yellow arrowhead indicates Lm not associated with actin. Scale bar, 10 μm. Two independent experiments (n=100 cells analyzed in each) were performed; in Exp. 1, 72% of Lm were associated with actin and in Exp. 2 80% were. (H) Representative images from one of three independent plaque assays using SVEC4–10 cells or L2 fibroblasts infected with Lm SD2000 and visualized 4 dpi.