
Fig. 4. Primary FRC and BEC infected ex vivo support exponential growth of intracellular L. monocytogenes.
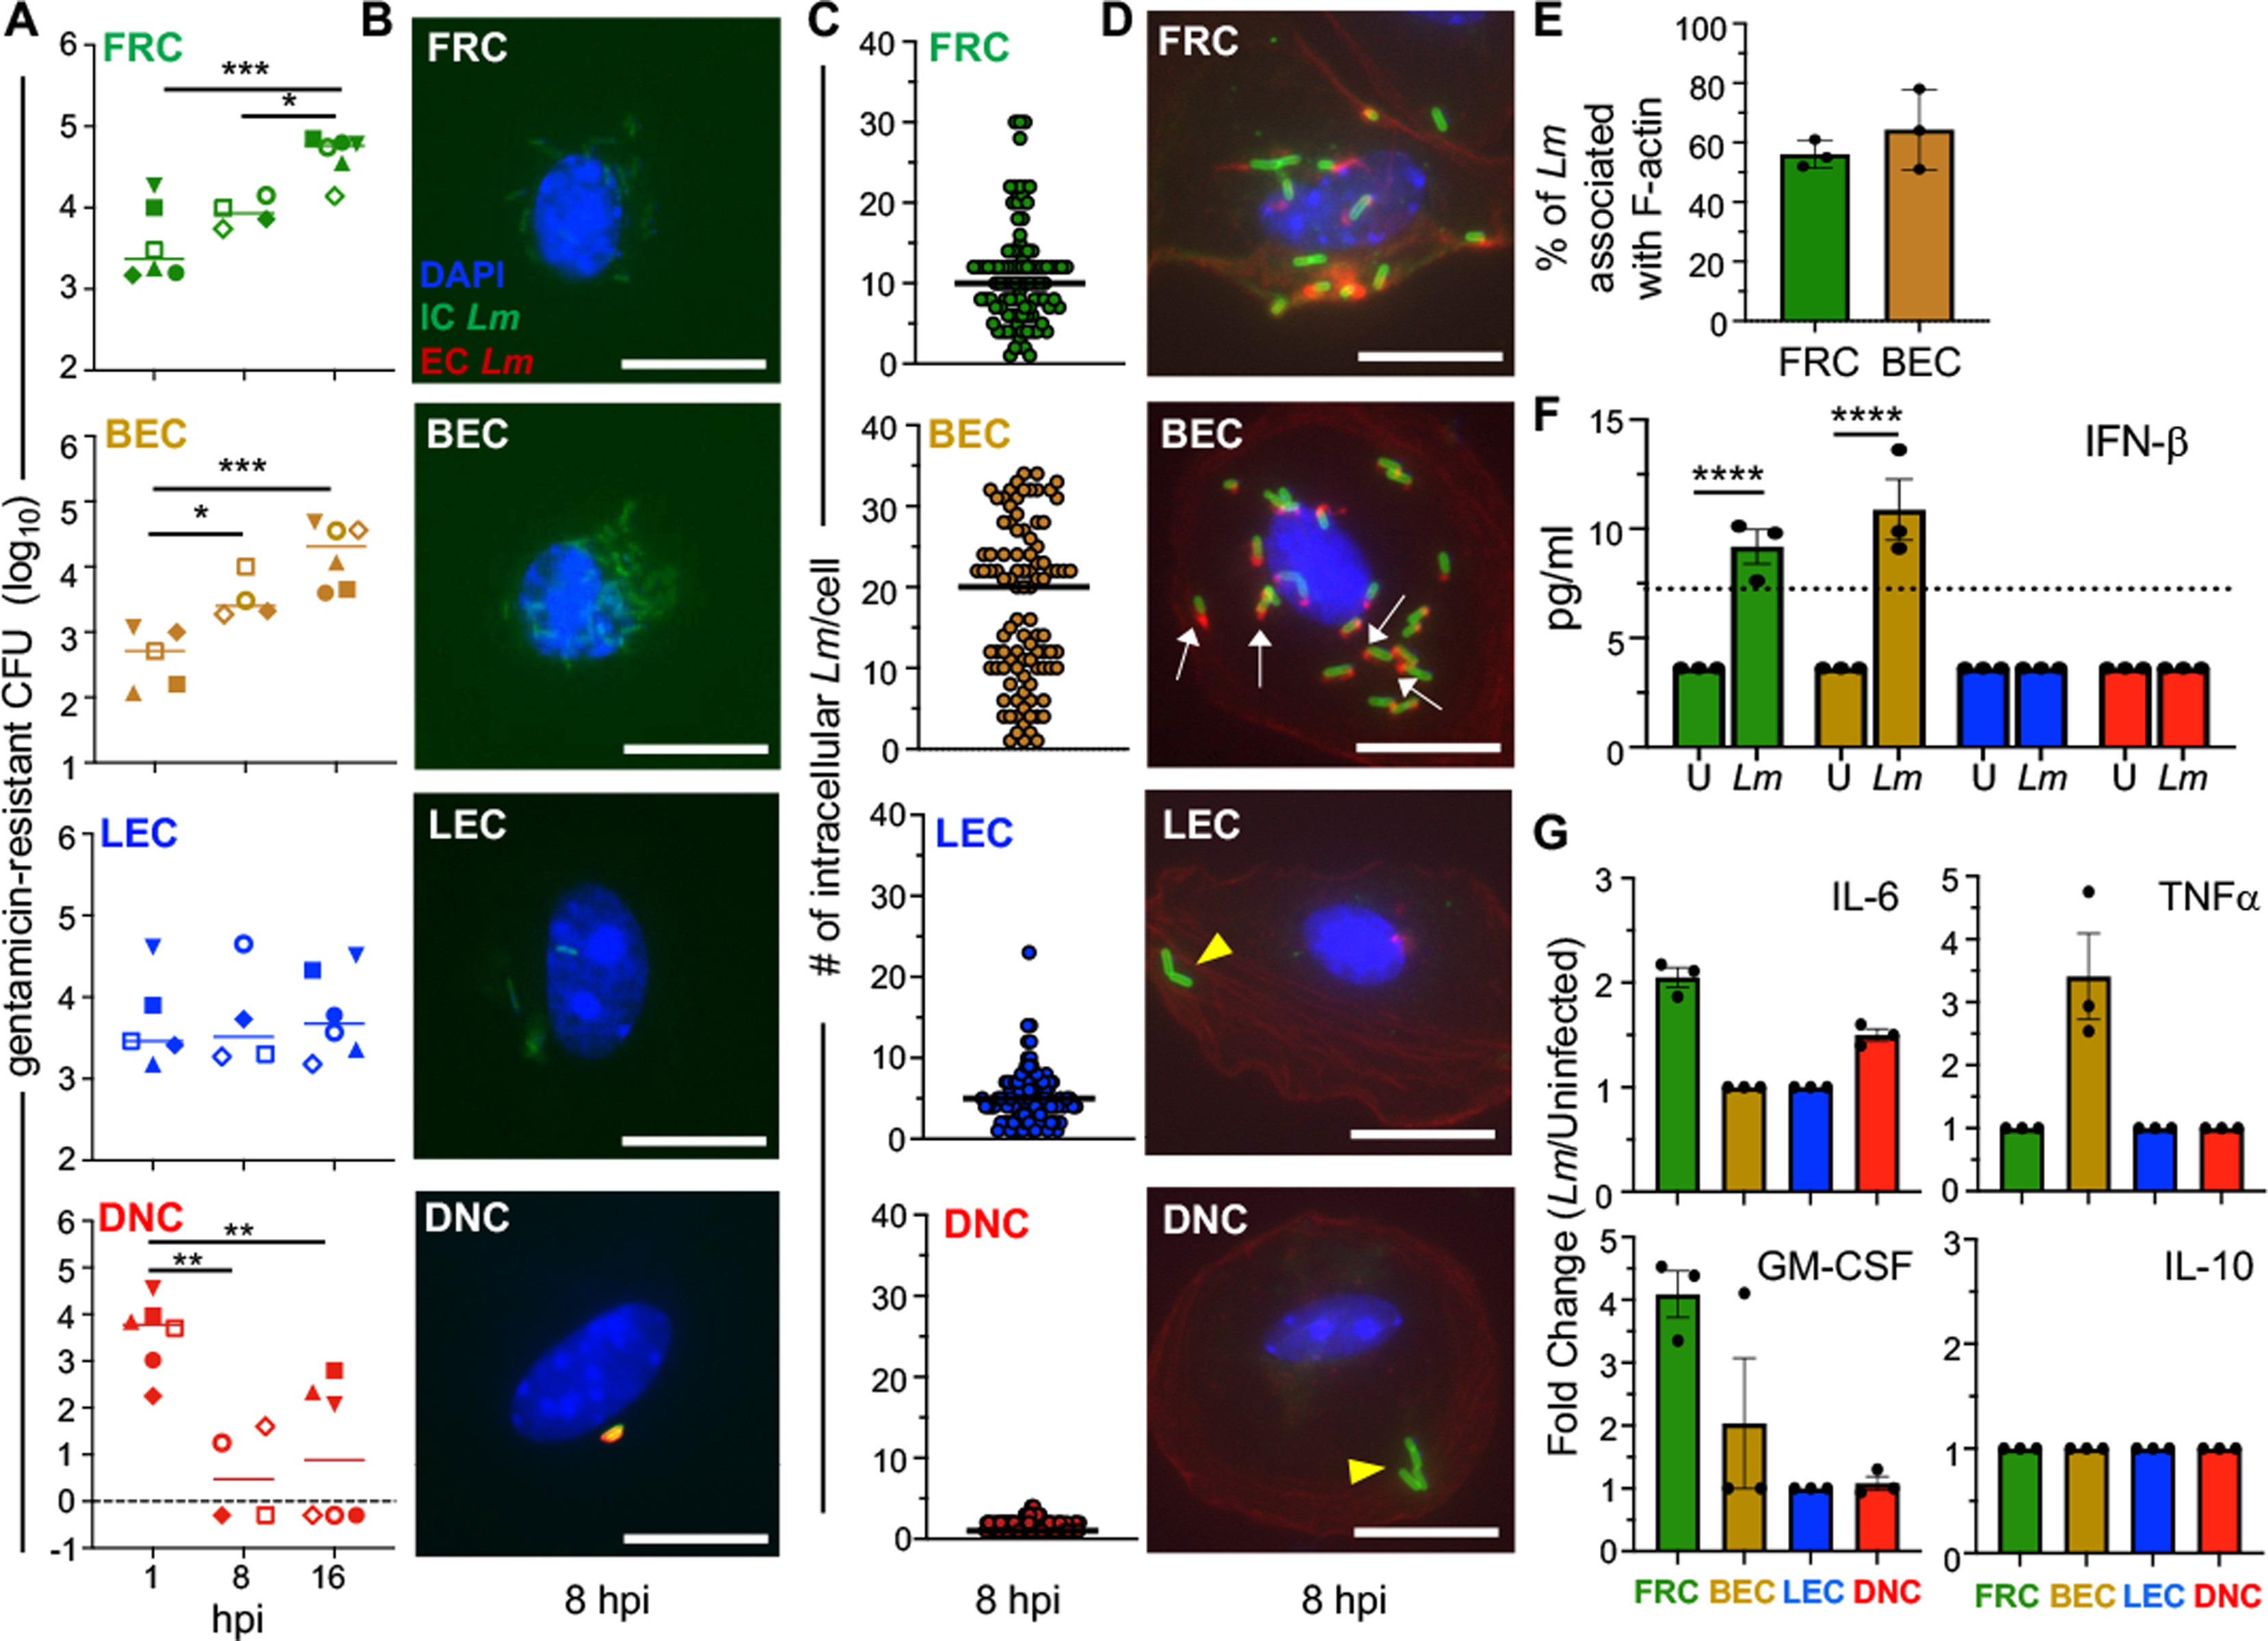
LNSC were sort-purified from the MLN and PLN of uninfected BALBc/ByJ mice and infected with Lm at an MOI of 10. (A) Gentamicin protection assay for cells infected with Lm SD2000; pooled data from eight separate experiments (each designated by a different symbol type) were analyzed by ANOVA with Tukeys multiple comparison test. In each experiment, total cells sorted from three mice were used at two time points. (B) Representative images for differential ”in/out” staining of sort-purified LNSC infected with Lm SD2710 (GFP+), fixed at 8 hpi and stained with DAPI (nuclei; blue), and anti-Lm antibody (red); scale bar, 5 μm. (C) Symbols indicate the number of intracellular Lm observed in a single infected cell; horizontal lines indicate median values for n=100 cells. For panels B and C, data from one of two independent experiments are shown. (D) Representative images for phalloidin staining of cells infected with Lm SD2710. White arrows indicate actin tails associated with Lm; yellow arrowheads indicate Lm not associated with actin. Scale bar, 5 μm. (E) Mean percent (±SEM) of intracellular Lm associated with actin. Each symbol represents results from a single experiment. (F) IFNβ present in supernatants of uninfected (U) and Lm SD2000-infected (Lm) cells (3 × 10⁴ cells/well) at 16 hours was measured by multiplex immunoassay; symbols indicate mean values (+/− SEM) for duplicate samples from three separate experiments and were analyzed by one-way ANOVA. (G) Fold change of cytokine responses measured by multiplex immunoassay in Lm-infected cells relative to uninfected cells. Dashed lines indicate limits of detection.