
Fig. 7. Live intracellular L. monocytogenes can be found within stromal populations following foodborne infection.
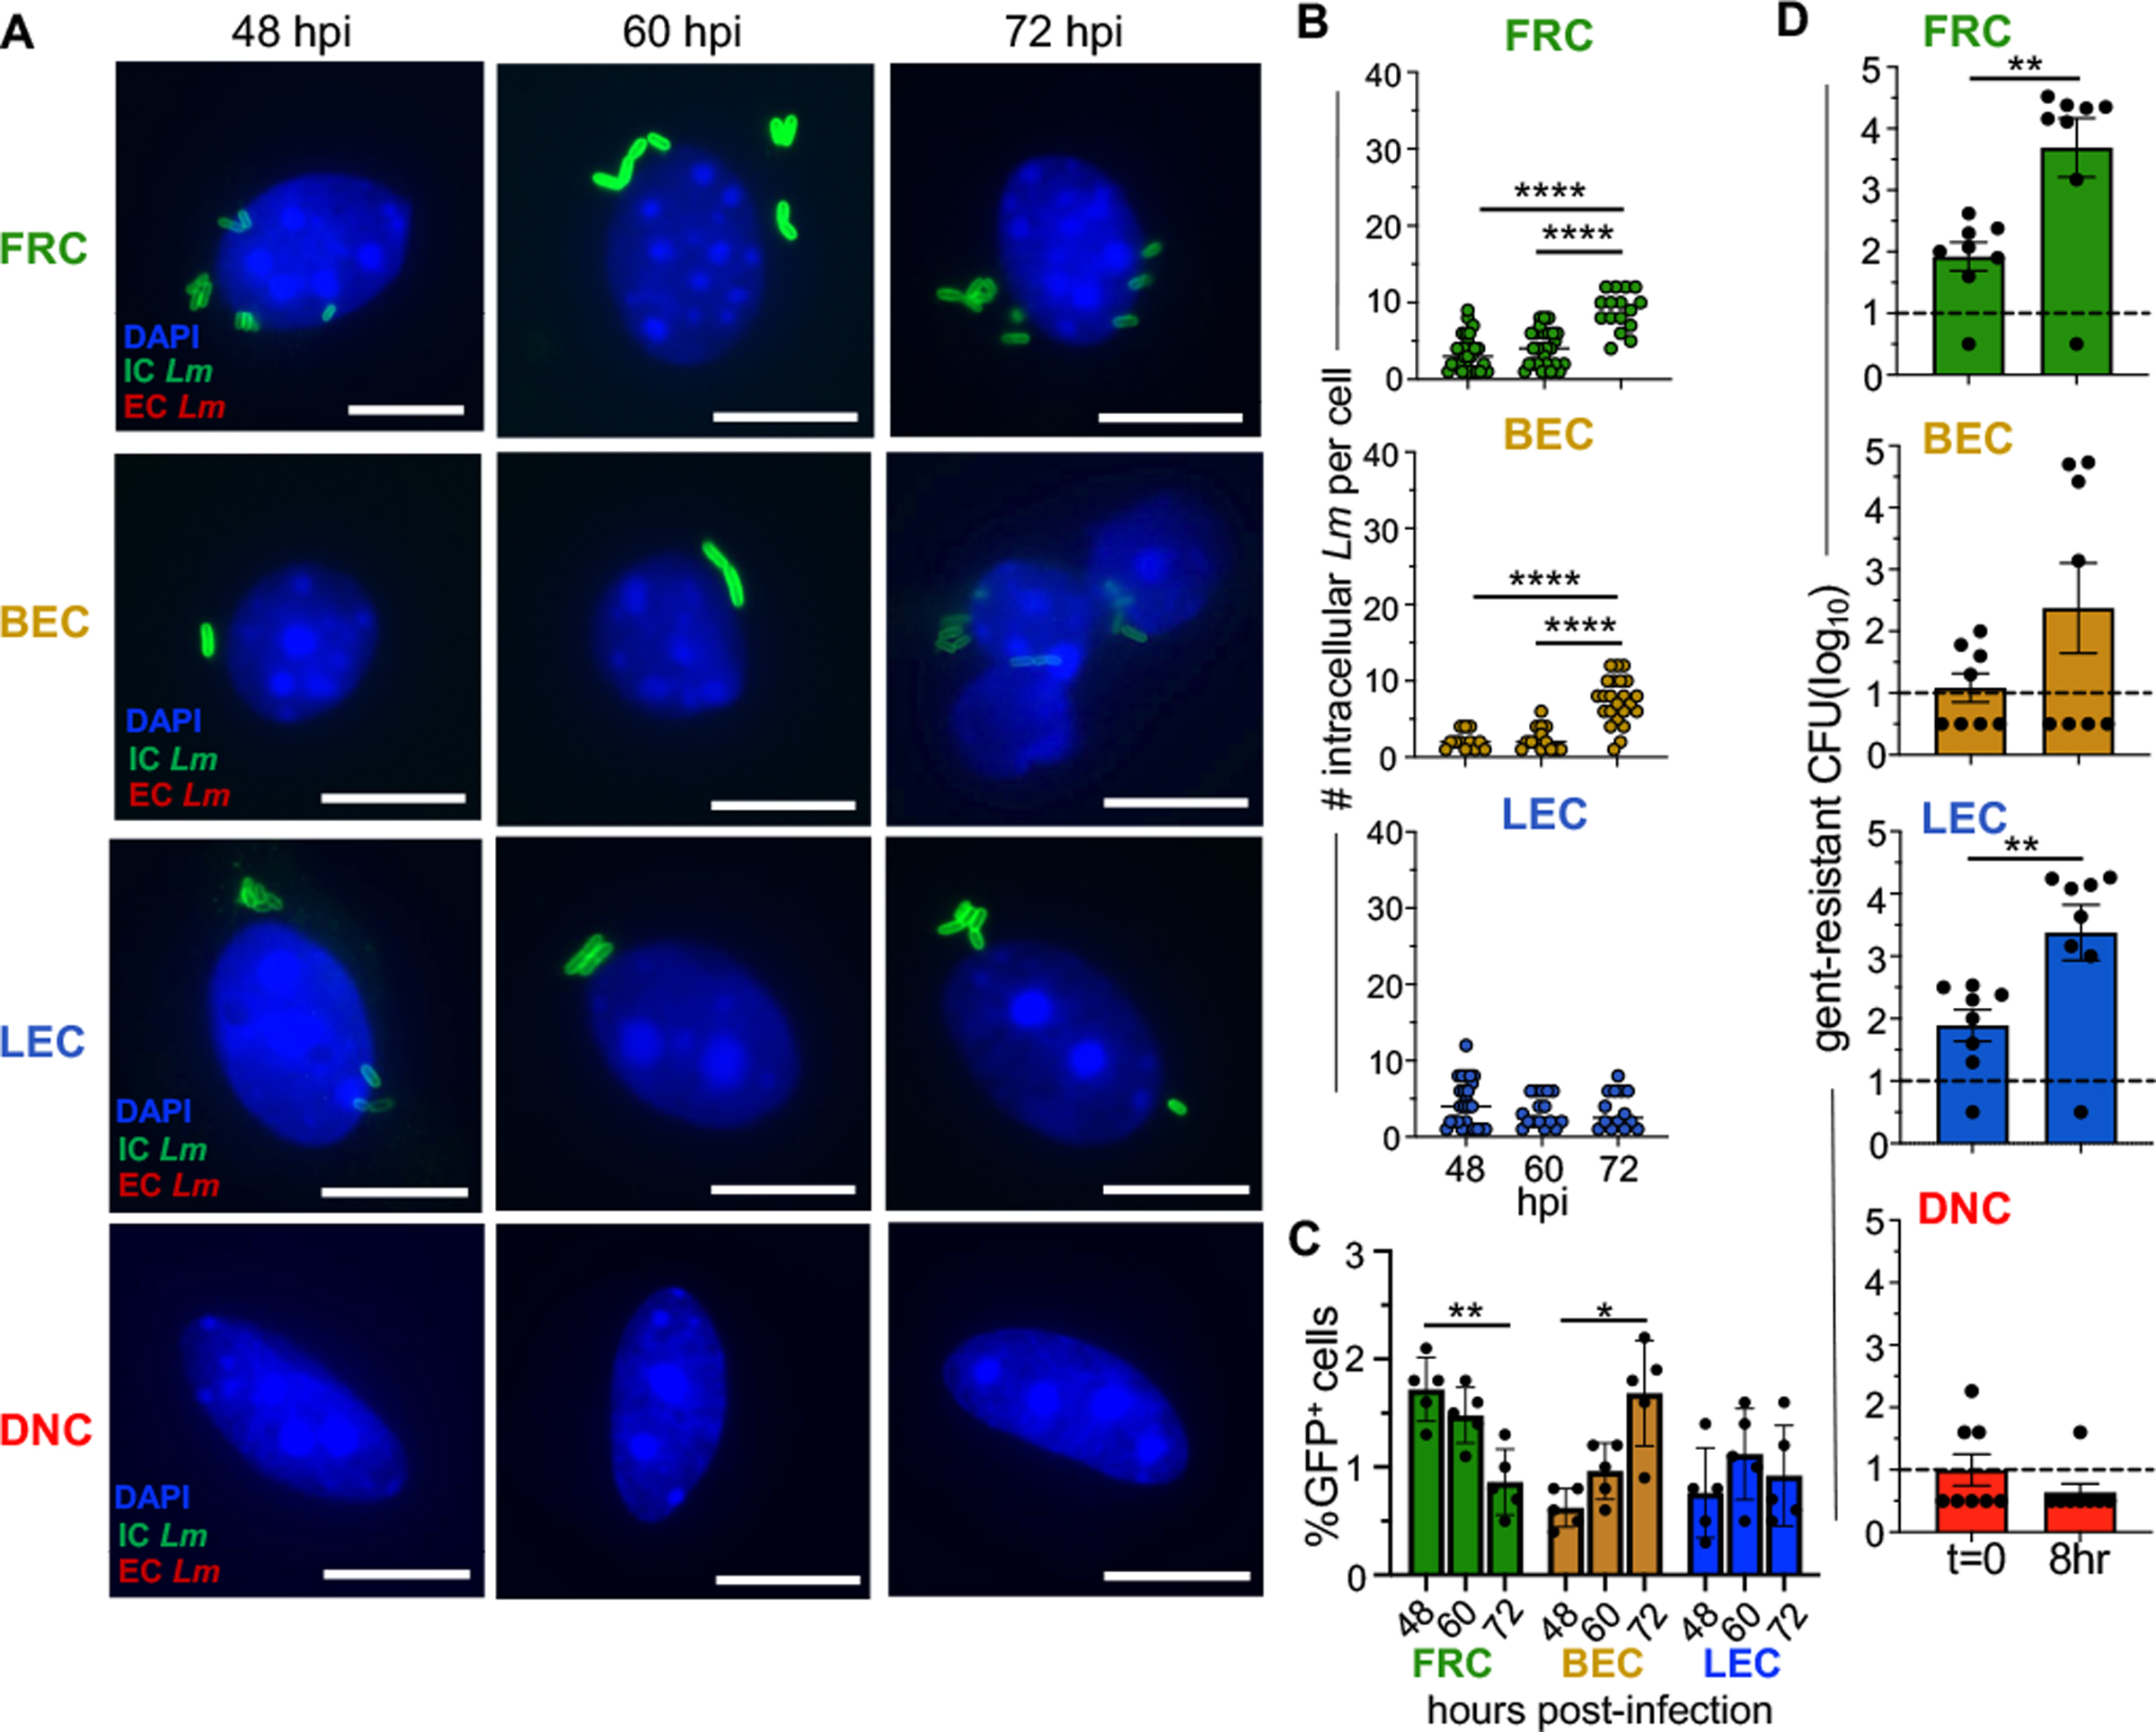
BALBc/ByJ mice were infected with 5 × 10⁸ CFU of Lm SD2710 and stromal populations were sort-purified from pooled MLN at 48, 60 and 72 hpi. (A) Representative images for differential ”in/out” staining of stromal populations infected with Lm SD2710 at 48– 60- and 72-hours post-infection. Scale bar, 5 μm (B) Symbols represent individual cells in five experiments. Horizontal lines indicate mean values. Statistical significance was determined by ANOVA with Tukeys multiple comparison. At least 1500 cells of each population were visualized. (C) Average percentage (±SEM) of GFP+ cells in each stromal population. Each symbol represents results from a single experiment. Statistical significance was determined by Two-way ANOVA with Tukey’s multiple comparisons. (D) Symbols indicate the number of gentamicin-resistant L. monocytogenes found within stromal populations at 48 hpi immediately post-sort (t=0) or after an 8 h incubation. Bars indicate mean value (±SEM); Dashed line indicate the limit of detection. Statistical significance was determined by Mann-Whitney analysis.