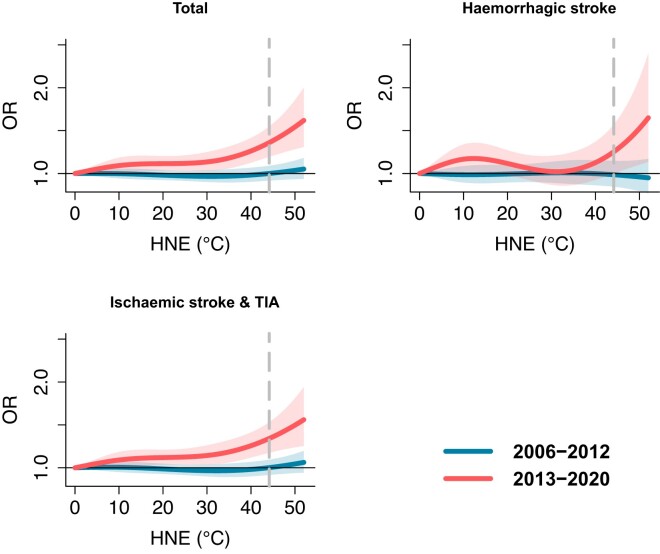
Figure 1.
Cumulative exposure–response relationships between hot night excess (HNE) and stroke risk over Lag 0–6 days for 2006–12 and 2013–20 with corresponding 95% confidence intervals (shaded areas). The vertical dashed line represents the 97.5th percentiles of the HNE distribution. Hot night excess represents the excess sum of high temperatures during the night when hourly temperatures are higher than the 95th percentile of daily minimum temperature during the whole study period. For instance, HNE = 0°C indicates non-hot night days during the warm months. HNE = 40°C represents the cumulative sum of hourly nighttime temperatures exceeding the threshold with values accumulating up to 40°C

