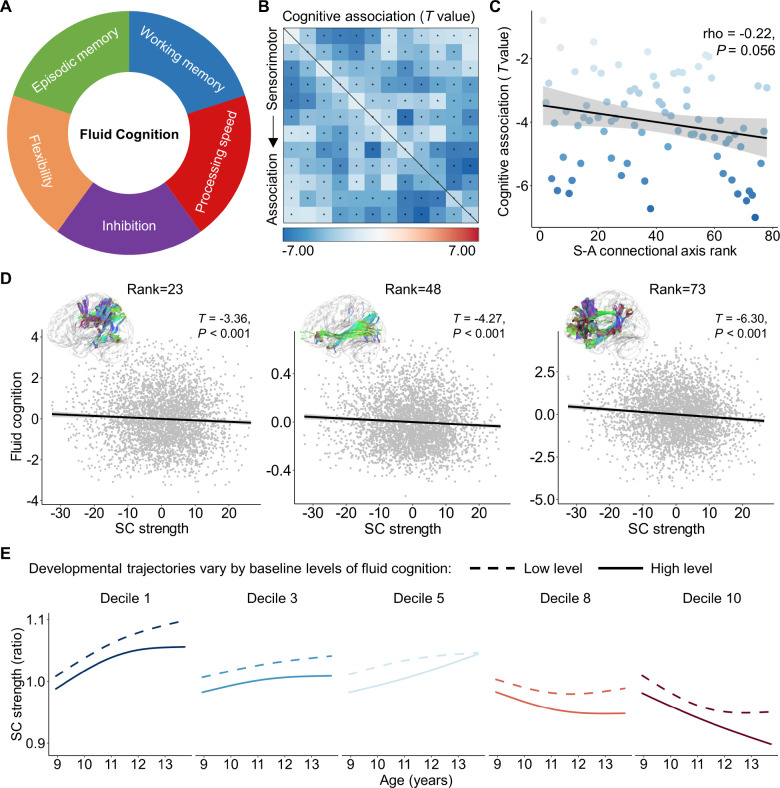
Figure 6. The spatial variation of the association between structural connectivity strength and higher-order cognition aligns with the S-A connectional axis.
A, Fluid cognition is a composite score of flanker inhibition, dimensional change card sort (flexibility), list sorting working memory, picture sequence episodic memory, and pattern comparison processing speed. B, Structural connectivity strength is associated with the individual differences in fluid cognition across 3,871 children within the ABCD baseline dataset. The black asterisks indicate statistically significant associations (PFDR < 0.05). C, The effect sizes of the association between connectivity strength and fluid cognition negatively related (Spearman’s rho = −0.22, P = 0.056) to the S-A connectional axis ranks across all connections. D, Scatterplots of the association between structural connectivity strength and fluid cognitive performance for the three connectome edges with an S-A connectional axis rank of 23, 48, and 73, respectively. The x and y axes represent the residuals of structural strength and fluid cognitive performance after regressing out age, sex and head motion. Data points in the scatter plots represent each participant, the bold line indicates the best fit from linear models, and the shaded envelope denotes the 95% confidence interval. E, The developmental trajectories of structural connectivity strength are displayed for populations with low (the 10th percentile) and high (the 90th percentile) cognitive performance for five deciles of the S-A connectional axis. SC: structural connectivity; S-A: sensorimotor-association.

