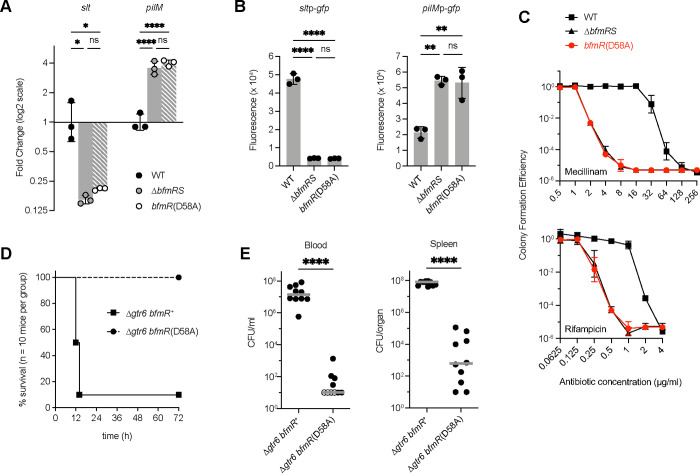
Fig. 2. bfmR(D58A) mutant shows BfmRS-null phenotypes.
(A) Analysis of slt and pilM transcription in the indicated A. baumannii strain by RT-qPCR. Data show geometric mean ± s.d. (n=3). (B) Analysis of transcriptional reporter fusions to slt and pilM promoters. Bars show mean normalized fluorescence (fluorescence units/A600) ± s.d. (n=3). (C) Antibiotic resistance assays. Colony forming efficiency was measured on solid medium with graded doses of mecillinam (top) or rifampicin (bottom) compared to control medium lacking drug. Data points show geometric mean ± s.d. (n=3). (D-E) Results from the mouse sepsis model. D shows mouse survival after intraperitoneal injection of bacteria (mean dose 7.3×10⁶ CFU with Δgtr6 bfmR+, 5.4×10⁶ CFU with Δgtr6 bfmR(D58A). Results were pooled from two independent experiments with 5 mice per group in each experiment. Survival curves are significantly different (Gehan-Breslow-Wilcoxon Test, p<0.0001). E shows bacterial burdens in the blood and spleen 12 hours after infection. Mean CFU in the inocula were 3.9×10⁶ [Δgtr6 bfmR+] and 4.0×10⁶ [Δgtr6 bfmR(D58A)]. Results were pooled from 2 independent experiments with 5 mice per group in each experiment. Each symbol represents one animal. Open symbols denote value below the limit of detection. Gray lines are medians. Differences between mutant and control were evaluated by Mann Whitney test. ns, P>0.05; *,P≤0.05; **, P≤0.01; ****, P≤0.0001.

